

The last 14 months, as strange and tragic as they've been, have afforded us an opportunity to gather unique datasets for experiments. From measuring the impact of a huge temporary drop in emissions to gauging the viability of a more remote workforce, the global pandemic has given us a large amount of testing data in a ton of fields that we wouldn't have had otherwise.
In the realm of sports, one thing we were fascinated by was the fact that games were being played with practically no fans. This wasn't just happening for a single game, series, or playoffs - over the last two regular seasons in the NBA, we've had 1,410 games with over 1,000 fans and 729 games with fewer than 1,000 fans!
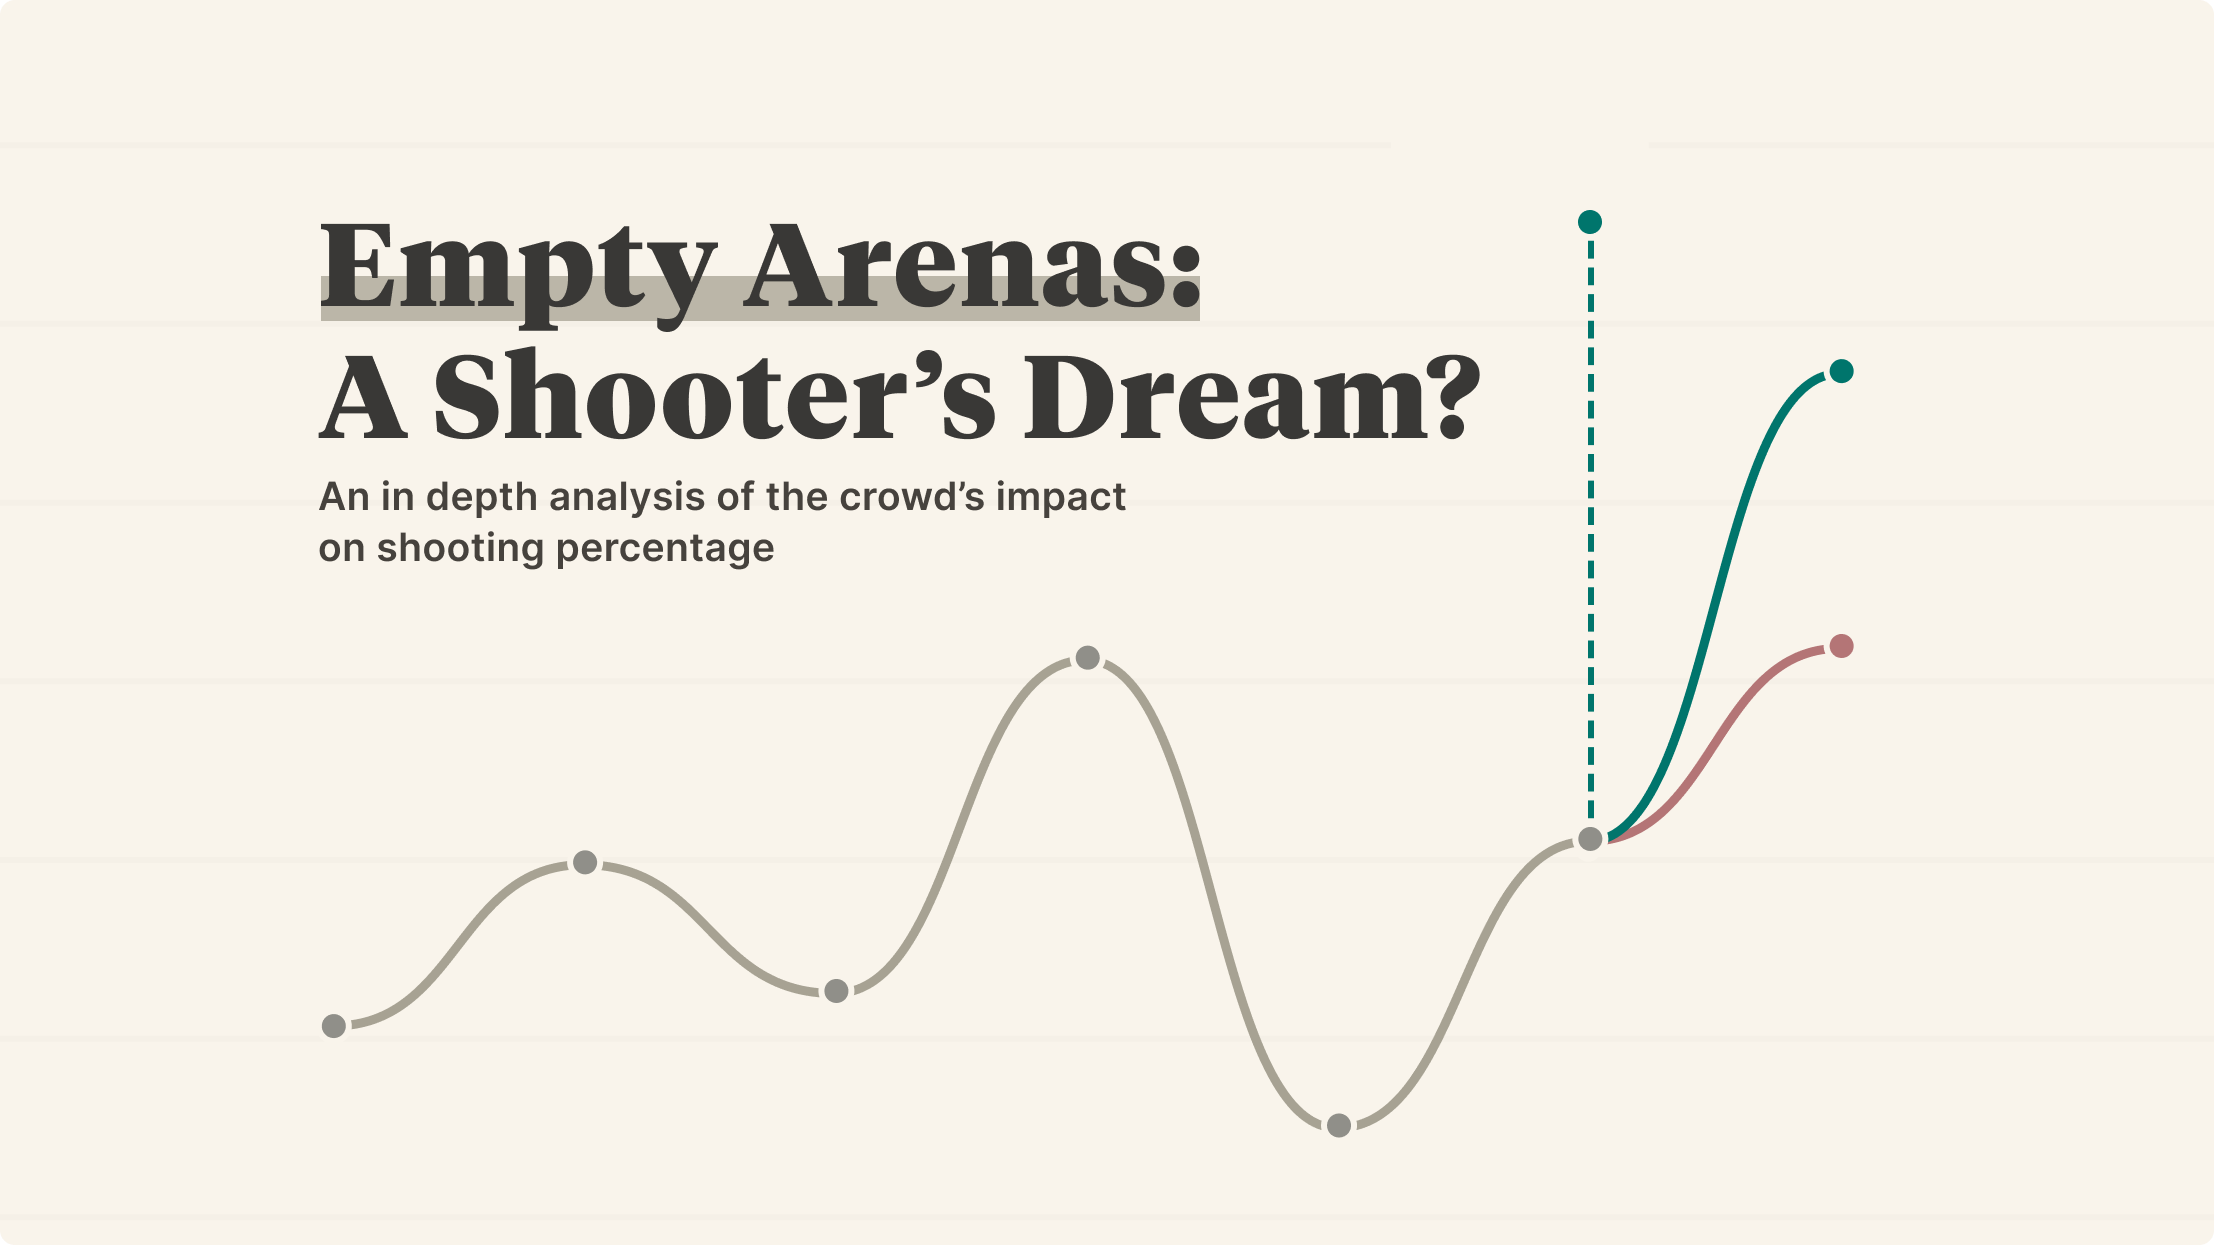
Making the most of a unique data set
Anecdotally, it seems like a ton of players have been shooting better in the last year. It's hard to tell whether that's confirmation bias, the league's natural progression, or if playing in an almost empty arena helps. Wanting to specifically gauge the impact of fans, we chose to measure free throw shooting and wide open 3-pointers, since those are two of the more controlled metrics in basketball.
Measuring something like all field goals, while giving us more data points, may introduce more variables than we want (i.e. the league might naturally be trending towards a certain pace, playstyle, ideal shot selection, etc., which could all affect the data). These factors can also affect the two metrics we're choosing to look at, but when setting up an experiment, it's important to minimize the impact of variables you're not interested in measuring as much as possible. This is one reason baseball has generally been a more analytics-friendly game than basketball - a lot more of the quantitative analysis measures closer-to-independent things!
Picking a timeframe
We decided to focus on a combined dataset of all shots from 2019-20 and 2020-21. Using only the latter season would have given us a more tightly scoped dataset, but using both seasons gives us a wider variety of different crowd sizes, so that was a tradeoff we were interested enough in to make. It's important to recognize what those tradeoffs are. At the expense of being able to more holistically compare big crowds and small crowds, we introduce some unwanted variables, like the fact that the schedule was more crammed this year and that there seemed to be more injuries across the board. This is why using highly controlled and relatively stable metrics is especially important.
High level numbers
Let's drill into some numbers. The tables below show data for our two metrics, broken up by makes vs. attempts and whether or not there was substantial attendance.
Free Throw Shooting in 2019-20 and 2020-21 (regular season only)
| Makes | Attempts | Percentage | |
|---|---|---|---|
| Minimal Attendance* | 25,348 | 32,526 | 77.93% |
| Substantial Attendance | 49,128 | 63,552 | 77.30% |
| Total | 74,476 | 96,078 | 77.52% |
Wide Open 3-Point Shooting** in 2019-20 and 2020-21 (regular season only)
| Makes | Attempts | Percentage | |
|---|---|---|---|
| Minimal Attendance* | 9,513 | 24,212 | 39.29% |
| Substantial Attendance | 17,325 | 45,002 | 38.50% |
| Total | 26,838 | 69,214 | 38.78% |
* We're using an attendance of 1000 as the cutoff for "minimal" vs "substantial" attendance in this essay, because there were some games where friends and family of the team were allowed. This is somewhat arbitrary, and adjusting the threshold to down 0 or up to 2500 didn't seem to make a huge difference.
** We're using nba.com's definition of "wide open", which is that the closest defender was at least 6 feet away. We also considered calling this a "socially distant" 3-pointer.
How to interpret p-values
Testing for a p-value involves establishing a "null hypothesis", which in our case is "there is no relationship in open shooting between there being a minimal or a substantial amount of fans", and gives us the probability that we would have observed what we did if that null hypothesis were true.
P-values are between 0 and 1, and the closer it is to 0 the more confidence we should have in rejecting the null hypothesis. P-values are a bit of a source of controversy in the broader research community because of their misuse and that they're highly dependent on the setup of the experiment. This is why we wanted to be transparent with our methodology and what we're measuring, and sharing raw p-number values instead of claiming statistical significance.
The p-values presented in this essay were calculated using a permutation test. This test takes two groups (say, 2500 free throws at home and 2400 free throws away), and buckets them all together. The joined data is then randomly split into groups of the original group sizes (2500 and 2400), and the difference in mean between the two groups is computed. We can then compare the observed difference (home vs away ft%) to what appears when we randomly sample the combined group to get an idea of how likely a mean difference of at least that size would appear even if the groups were originally from the same distribution. Learn more here.
Fluctuations
Okay! So far, we've observed that:
- Free throw shooting with a minimal amount of fans has yielded about a 0.63% difference
- Wide open 3-point shooting with a minimal amount of fans has yielded about a 0.79% difference
But what does that mean? Without having the context of how these numbers change every year, it's hard to contextualize this data.
Let's chart out data for each regular season since 2014-15 for the two shot types we're focusing on.
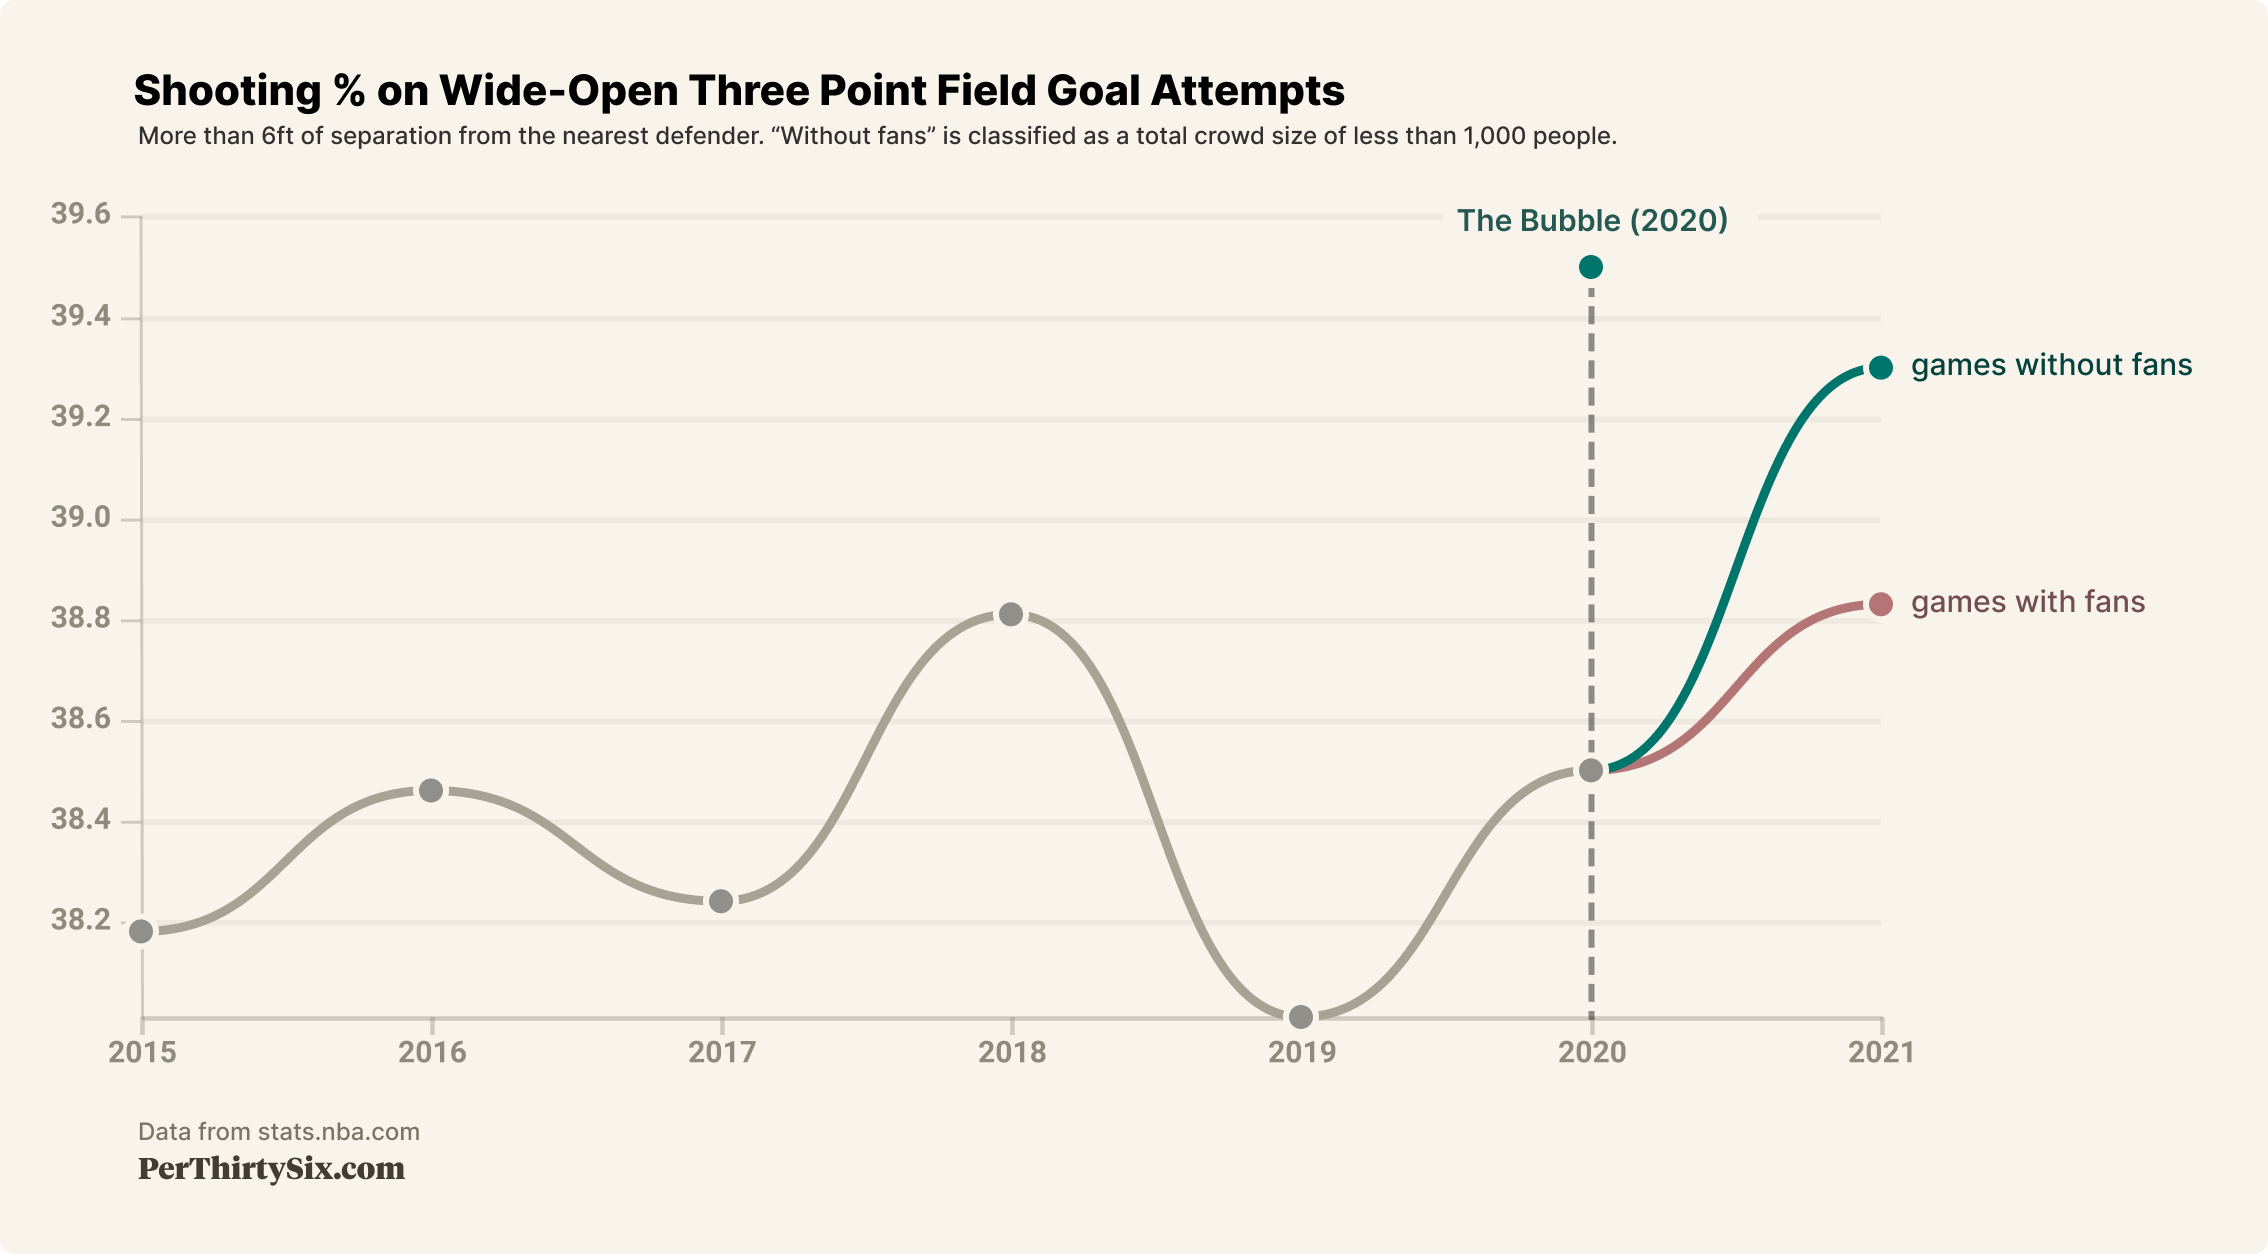
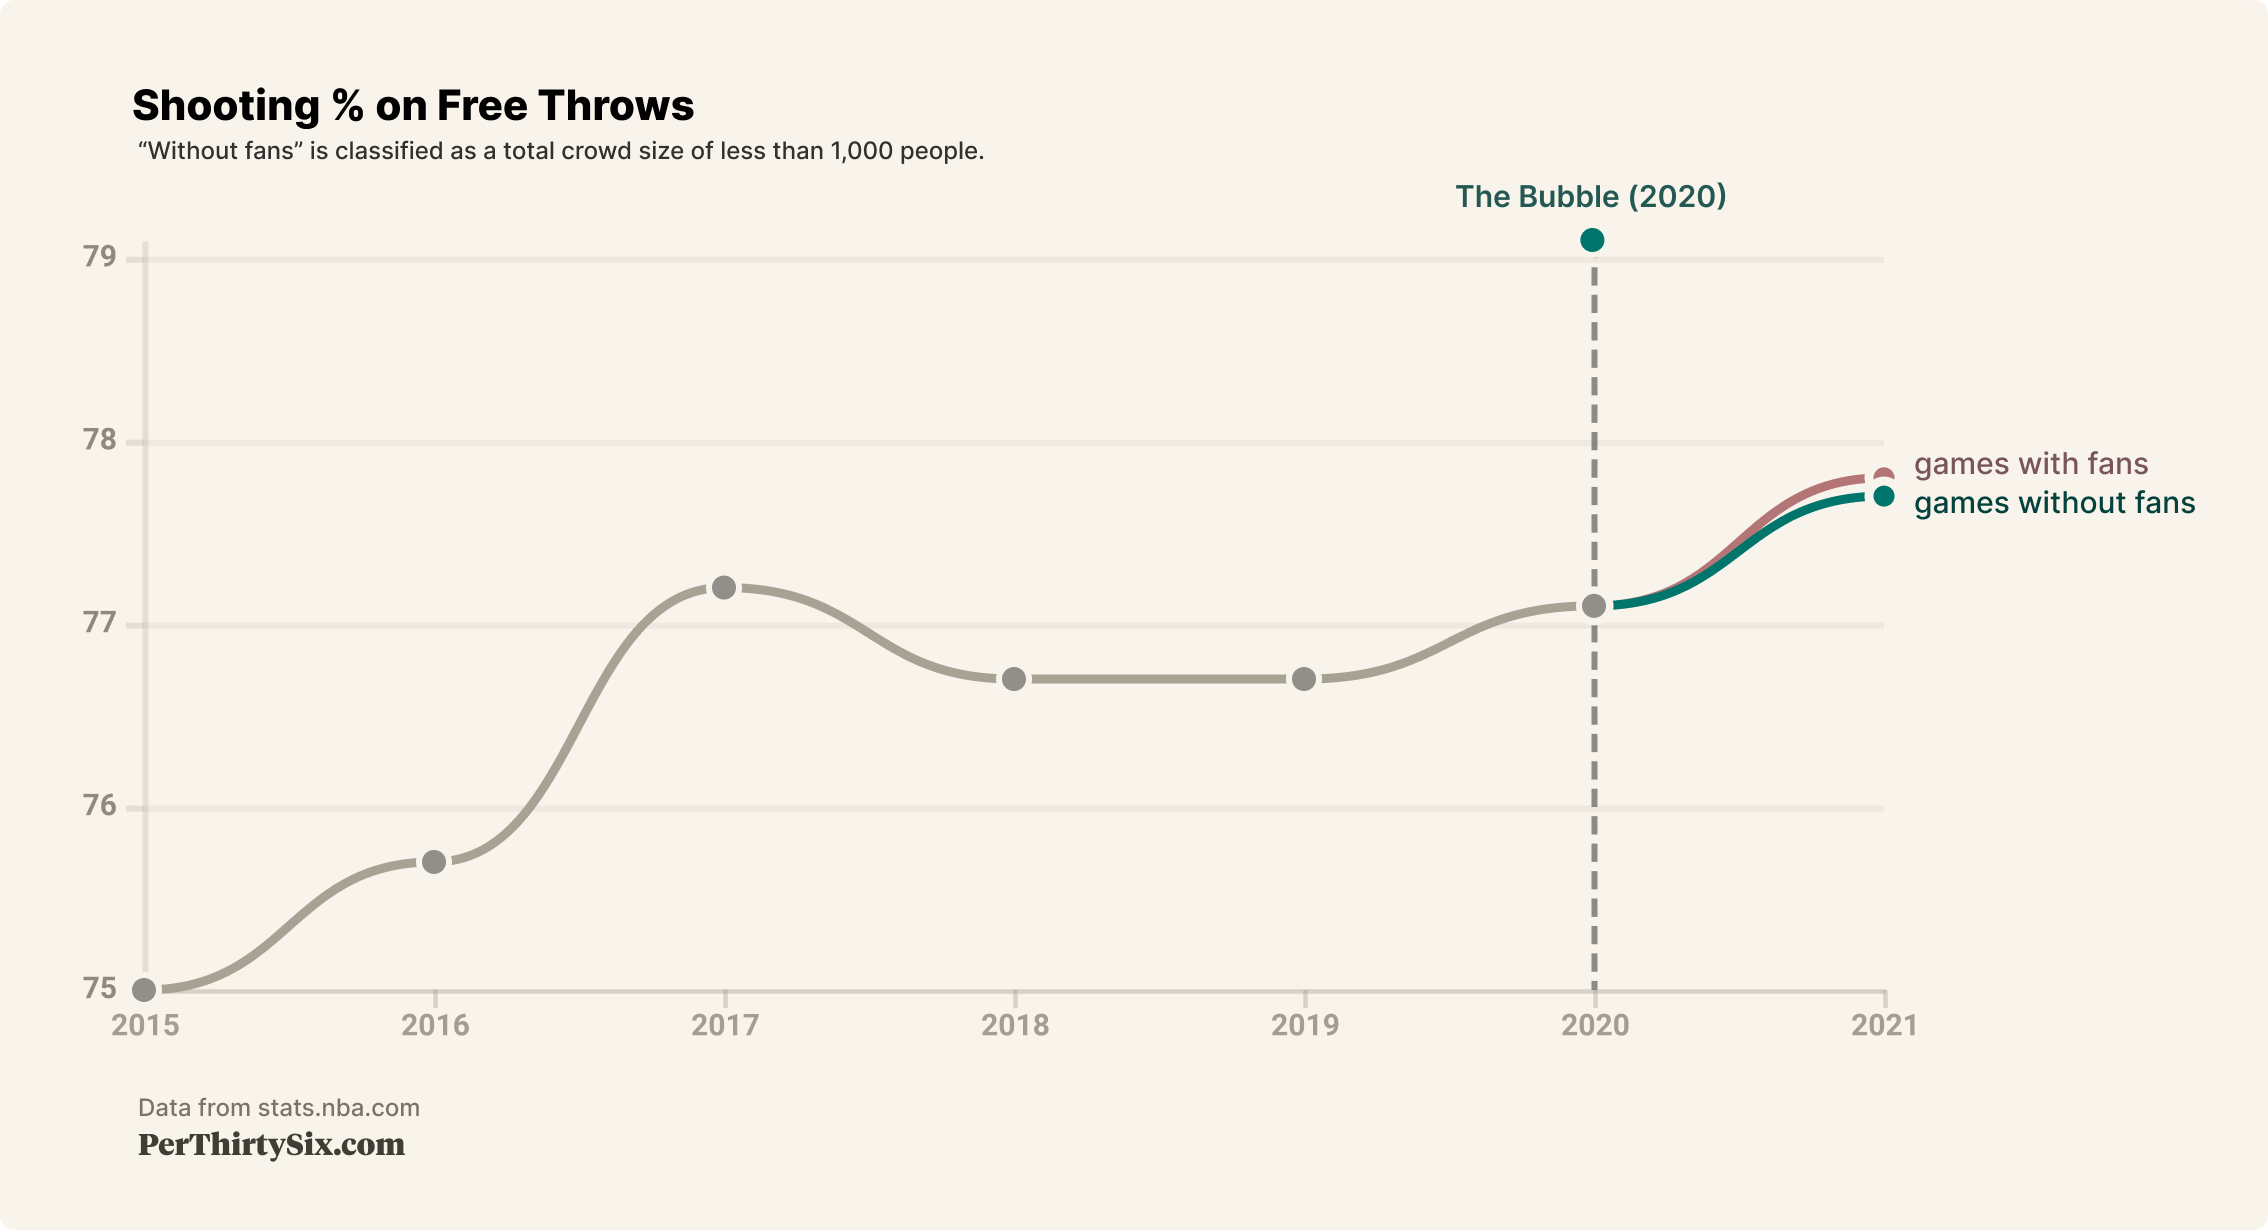
We can see that in the 2020-21 regular season, there was practically no difference in free throw shooting based on the presence of fans, but there does seem to be a sizable difference in wide open 3-point shooting.
Also interesting to note is that the bubble yielded really hot shooting for both of our metrics. It's important to keep in mind that the bubble is a relatively small sample size (88 games), only competitive teams were invited, and players were coming off several months of rest. With all this in mind, the data here supports our eye test - shooting was hot in the bubble.
It's hard to say exactly why wide open 3-point shooting has been so much better relatively without fans than free throw shooting, but a reasonable guess is just that it requires more concentration and depth perception, which are both easier to achieve in an emptier arena.
Home is where the heart is
Another question that came up as we explored this was how playing at home factors into all of this. Here are the same high-level numbers broken down by home court advantage:
Free Throw Shooting in 2019-20 and 2020-21 (regular season only)
| Makes | Attempts | Percentage | |
|---|---|---|---|
| Minimal Attendance (Home) | 12,792 | 16,438 | 77.82% |
| Minimal Attendance (Away) | 12,556 | 16,088 | 78.05% |
| Substantial Attendance (Home) | 25,023 | 32,322 | 77.42% |
| Substantial Attendance (Away) | 24,105 | 31,230 | 77.19% |
p-value (home with fans vs away with fans): 0.4902
Wide Open 3-Point Shooting in 2019-20 and 2020-21 (regular season only)
| Makes | Attempts | Percentage | |
|---|---|---|---|
| Minimal Attendance (Home) | 4,826 | 12,258 | 39.37% |
| Minimal Attendance (Away) | 4,687 | 11,954 | 39.21% |
| Substantial Attendance (Home) | 8,766 | 22,558 | 38.86% |
| Substantial Attendance (Away) | 8,559 | 22,444 | 38.13% |
p-value (home with fans vs away with fans): 0.1163
Unsurprisingly, the worst combination for both free throws and wide open 3-pointers was shooting on the road with a substantial amount of fans.
Check out your favorite team
In case you were curious about how all these different variables affected your favorite team, you check out the table below!
Note that, like the rest of this essay, this table combines regular season data from 2019-20 and 2020-21.
| Team | Home % (Minimal Fans) | Home % (Substantial Fans) | Away % (Minimal Fans) | Away % (Substantial Fans) | Overall % |
|---|---|---|---|---|---|
| Phoenix Suns | 86.5% | 81.5% | 84.9% | 84.4% | 83.4% |
| Portland Trail Blazers | 82.9% | 81.9% | 84.3% | 77.9% | 81.3% |
| Los Angeles Clippers | 82.5% | 79.1% | 85.4% | 80.2% | 81.1% |
| Toronto Raptors | 82.9% | 80.7% | 79.6% | 79.2% | 80.5% |
| Atlanta Hawks | 79.7% | 80.3% | 83.0% | 78.5% | 80.2% |
| San Antonio Spurs | 77.5% | 80.6% | 81.3% | 80.3% | 80.1% |
| Golden State Warriors | 78.3% | 82.0% | 78.6% | 77.8% | 79.4% |
| Indiana Pacers | 77.9% | 78.2% | 79.0% | 80.6% | 79.0% |
| Denver Nuggets | 76.6% | 77.8% | 80.4% | 80.9% | 78.9% |
| Boston Celtics | 79.0% | 81.2% | 75.5% | 78.1% | 78.9% |
| Utah Jazz | 79.4% | 80.0% | 77.5% | 78.0% | 78.9% |
| Miami Heat | 80.6% | 78.7% | 77.7% | 77.4% | 78.6% |
| Dallas Mavericks | 76.8% | 77.4% | 79.4% | 77.9% | 77.9% |
| Washington Wizards | 75.1% | 79.1% | 77.5% | 78.8% | 77.8% |
| Orlando Magic | 76.7% | 77.1% | 78.7% | 77.5% | 77.5% |
| Brooklyn Nets | 79.1% | 75.1% | 80.0% | 77.3% | 77.4% |
| Chicago Bulls | 79.4% | 75.7% | 80.3% | 75.7% | 77.3% |
| Houston Rockets | 80.7% | 75.6% | 75.4% | 78.3% | 76.8% |
| Memphis Grizzlies | 79.4% | 77.0% | 77.0% | 75.3% | 76.7% |
| Oklahoma City Thunder | 72.7% | 80.6% | 74.7% | 76.9% | 76.3% |
| Philadelphia 76ers | 77.3% | 76.1% | 76.9% | 75.0% | 76.1% |
| Minnesota Timberwolves | 77.2% | 74.6% | 73.5% | 77.0% | 75.7% |
| Sacramento Kings | 75.9% | 76.5% | 73.6% | 75.9% | 75.7% |
| Charlotte Hornets | 78.4% | 73.7% | 75.2% | 76.6% | 75.5% |
| Detroit Pistons | 74.6% | 73.6% | 78.2% | 75.5% | 75.2% |
| Milwaukee Bucks | 72.7% | 73.3% | 78.3% | 76.1% | 75.0% |
| Cleveland Cavaliers | 74.8% | 76.7% | 72.3% | 74.3% | 75.0% |
| New York Knicks | 77.2% | 73.9% | 76.3% | 71.8% | 73.9% |
| Los Angeles Lakers | 74.6% | 74.5% | 74.2% | 71.1% | 73.4% |
| New Orleans Pelicans | 73.4% | 73.2% | 73.7% | 71.9% | 72.9% |
We appreciate all of your support for PerThirtySix! If you have any feedback on this article or anything else we've done, please let us know. You can follow us on Twitter at @PerThirtySixers.
We're just getting started.
Subscribe for more thoughtful, data-driven explorations.