A NEWSLETTER FROM PERTHIRTYSIX
The Nine Thirty-Six
A letter from the two of us, most Mondays.
|
||
|
A LETTER FROM
RobIt's been an incredible week at PerThirtySix, with record-breaking traffic. Thank you for all of the the support and kind comments, it's really been overwhelming. In a world of quick releases and AI slop, we'll continue to put thought and care into everything we publish, and trust that it will find its way into good hands. NFL Draft Efficiency by PositionIn light of draft weekend, I launched two pages on PerThirtySix. The first is NFL Draft Efficiency by Position. It ranks every team at how well they've drafted each position over the last twenty years, ordered by value over expectation given where each player was selected overall. To no one's surprise, the Steelers rank #1 overall at drafting WRs, and the 49ers rank #1 at drafting LBs. 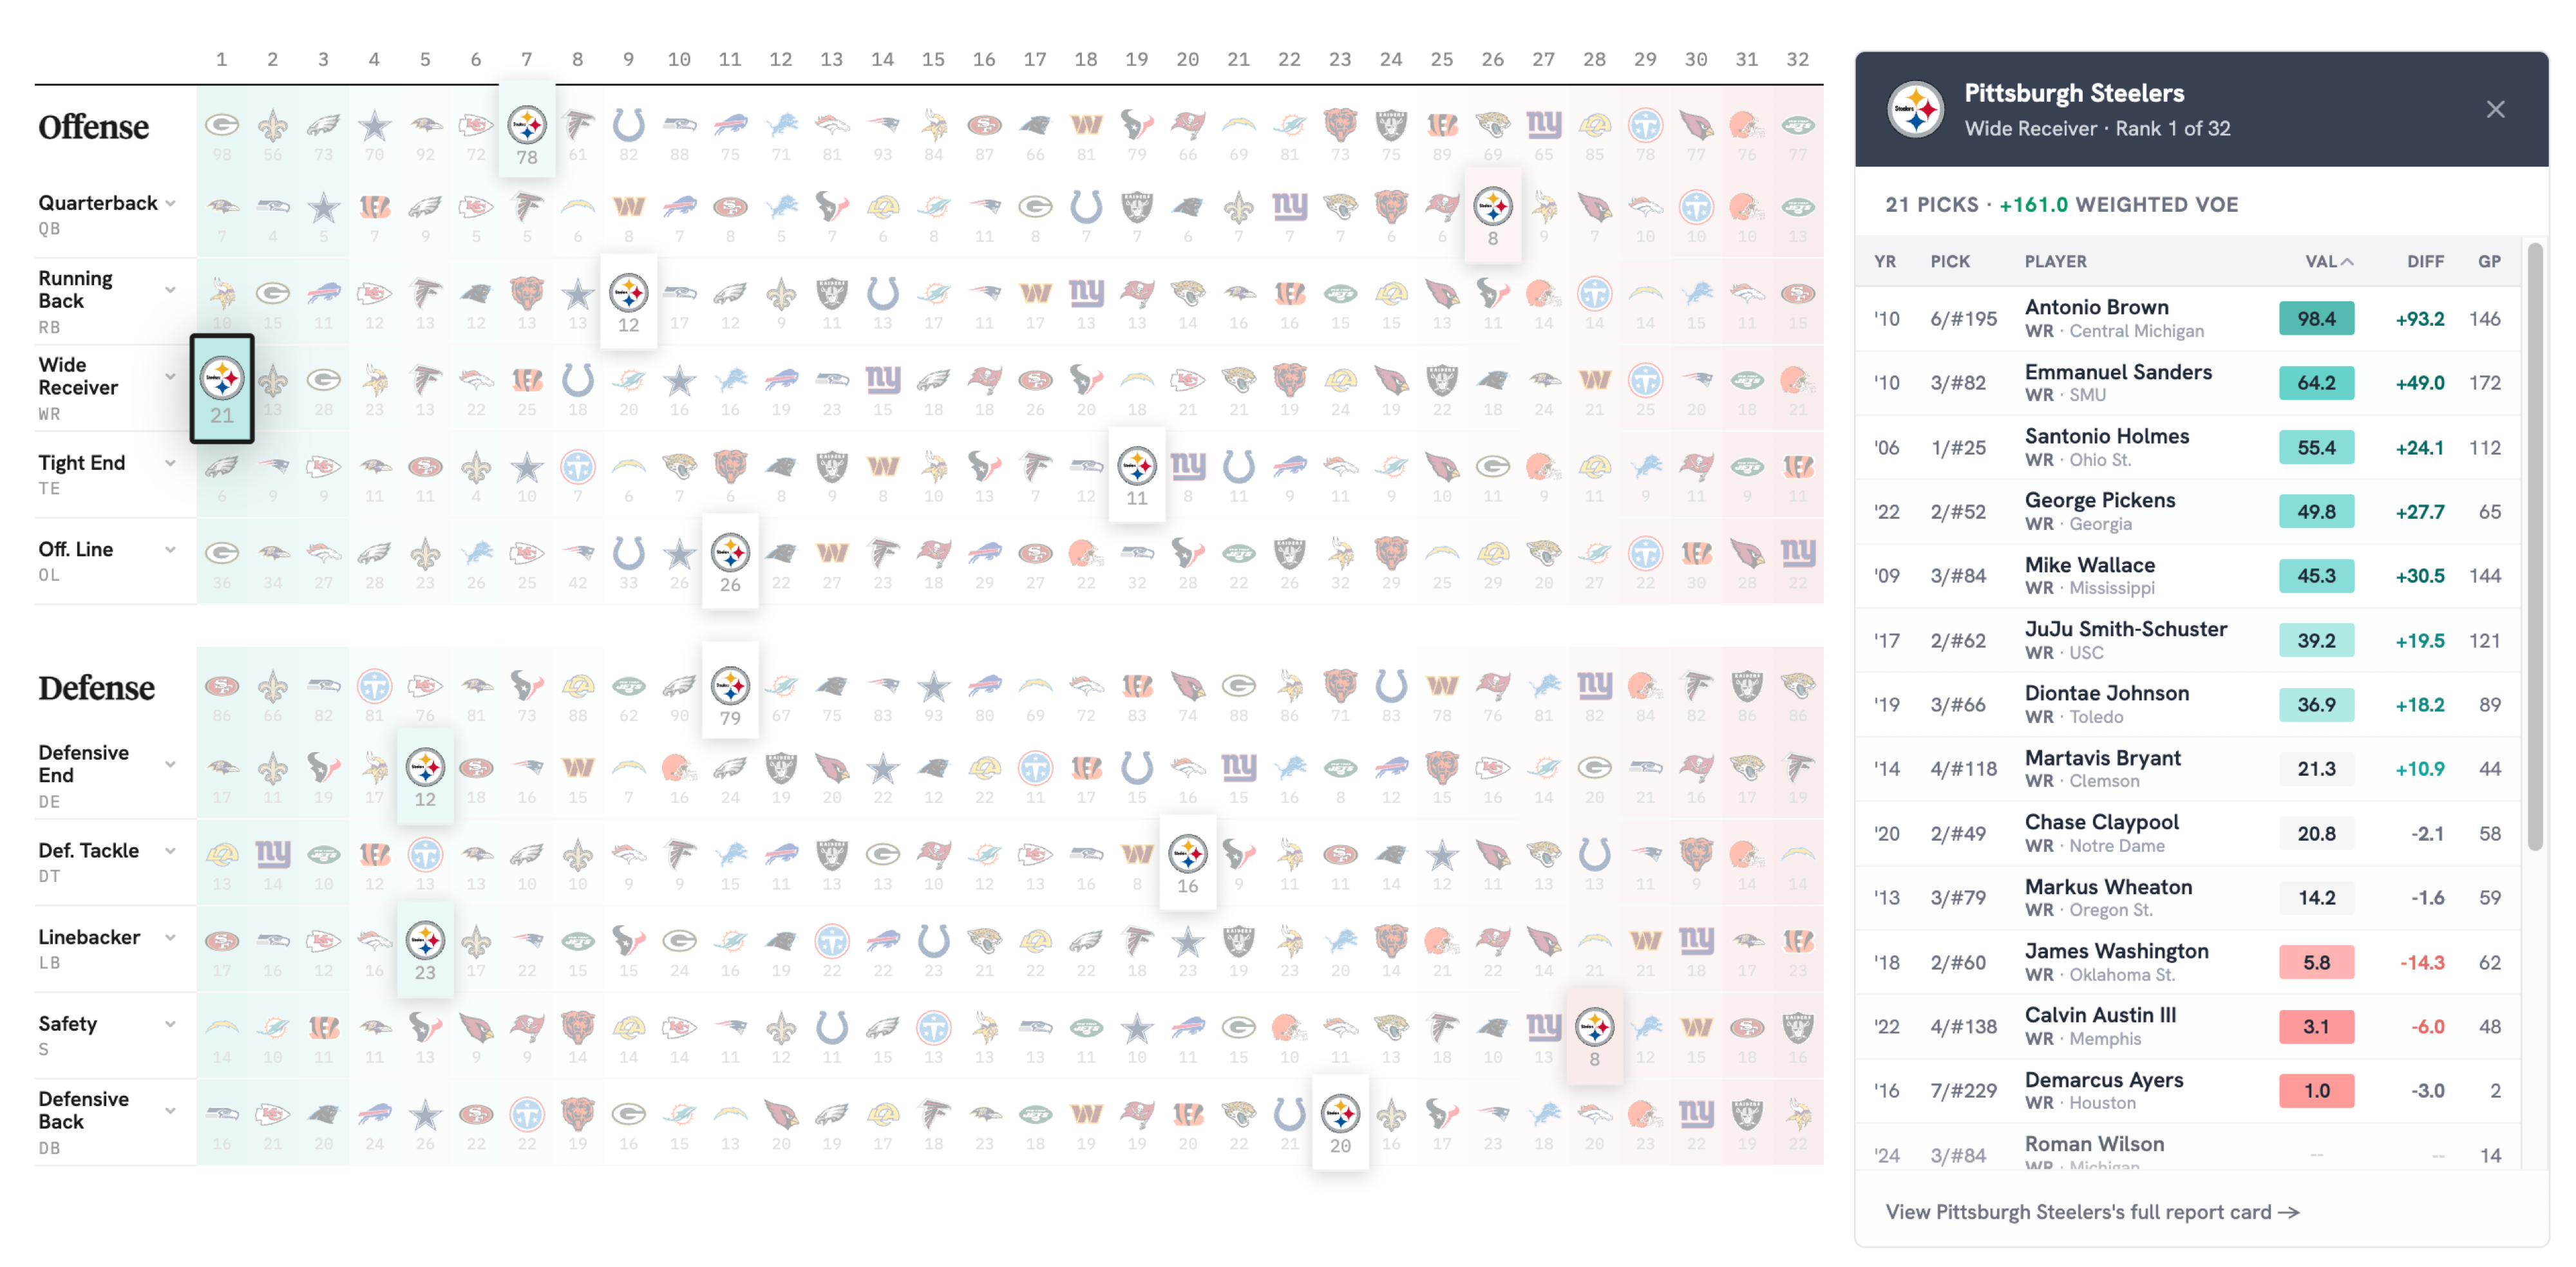
From Draft Efficiency by Position — Pittsburgh, drafting WRs. Scoring the 2026 Draft TradesMy larger piece of work is focused on draft-day trades. My theory is that NFL teams overpay when they trade up, but showing that in football is harder than it sounds. Baseball has WAR, which adds across a roster cleanly. Football does not, and the closest analogues don't survive the addition either; two competent careers and one elite career do not slot onto a roster the way their points sum. So the test I ran is the most conservative version of the question, originally posed by Thaler and Massey (2005). Forget the secondary picks entirely. And forget the chart math where you're adding up values of all the picks. The team trading up holds the highest pick of the deal, and you would think the highest pick is the best player of the trade. That's the premium they're paying for, right? Well, across every pick-for-pick trade since 2006, the trade-up side wins the (very conservative) best-player comparison 35% of the time. The trade-down side wins 45%. The remaining 20% land inside a five-pVAR coin-flip band, where neither side's best is decisively better. An illustration of this is Cleveland's 2011 trade-up for Phil Taylor. Kansas City ended up winning this trade, but only because their later pick (#70) became Justin Houston, an All-Pro whose career far outproduced Taylor's; their earlier pick (#26, Jonathan Baldwin) was a bust. Three modest swings beat one big swing more often than not, even before you start adding their value up. This gap has narrowed in more recent years, suggesting the market has started to pick up on the inefficiency. To project this year's 37 pick-for-pick trades, I ran Monte Carlo simulations against fifteen years of pVAR history. For each pick, an outcome is sampled from the careers of historical players taken at and near that slot, with closer slots weighted more heavily. The pool tightens near the top of the draft and widens through the late rounds. A position-weighted mode tilts each draw toward the drafted player's position group. According to the model, teams are still paying an excessive premium to trade up — worth it only for teams who are elite at identifying and developing talent. After the core analysis was done, I spent endless hours grooming over every pixel of these trade cards, as Shri can attest to with a continuous stream of screenshots from my local development versions. I'm really delighted with how they turned out. 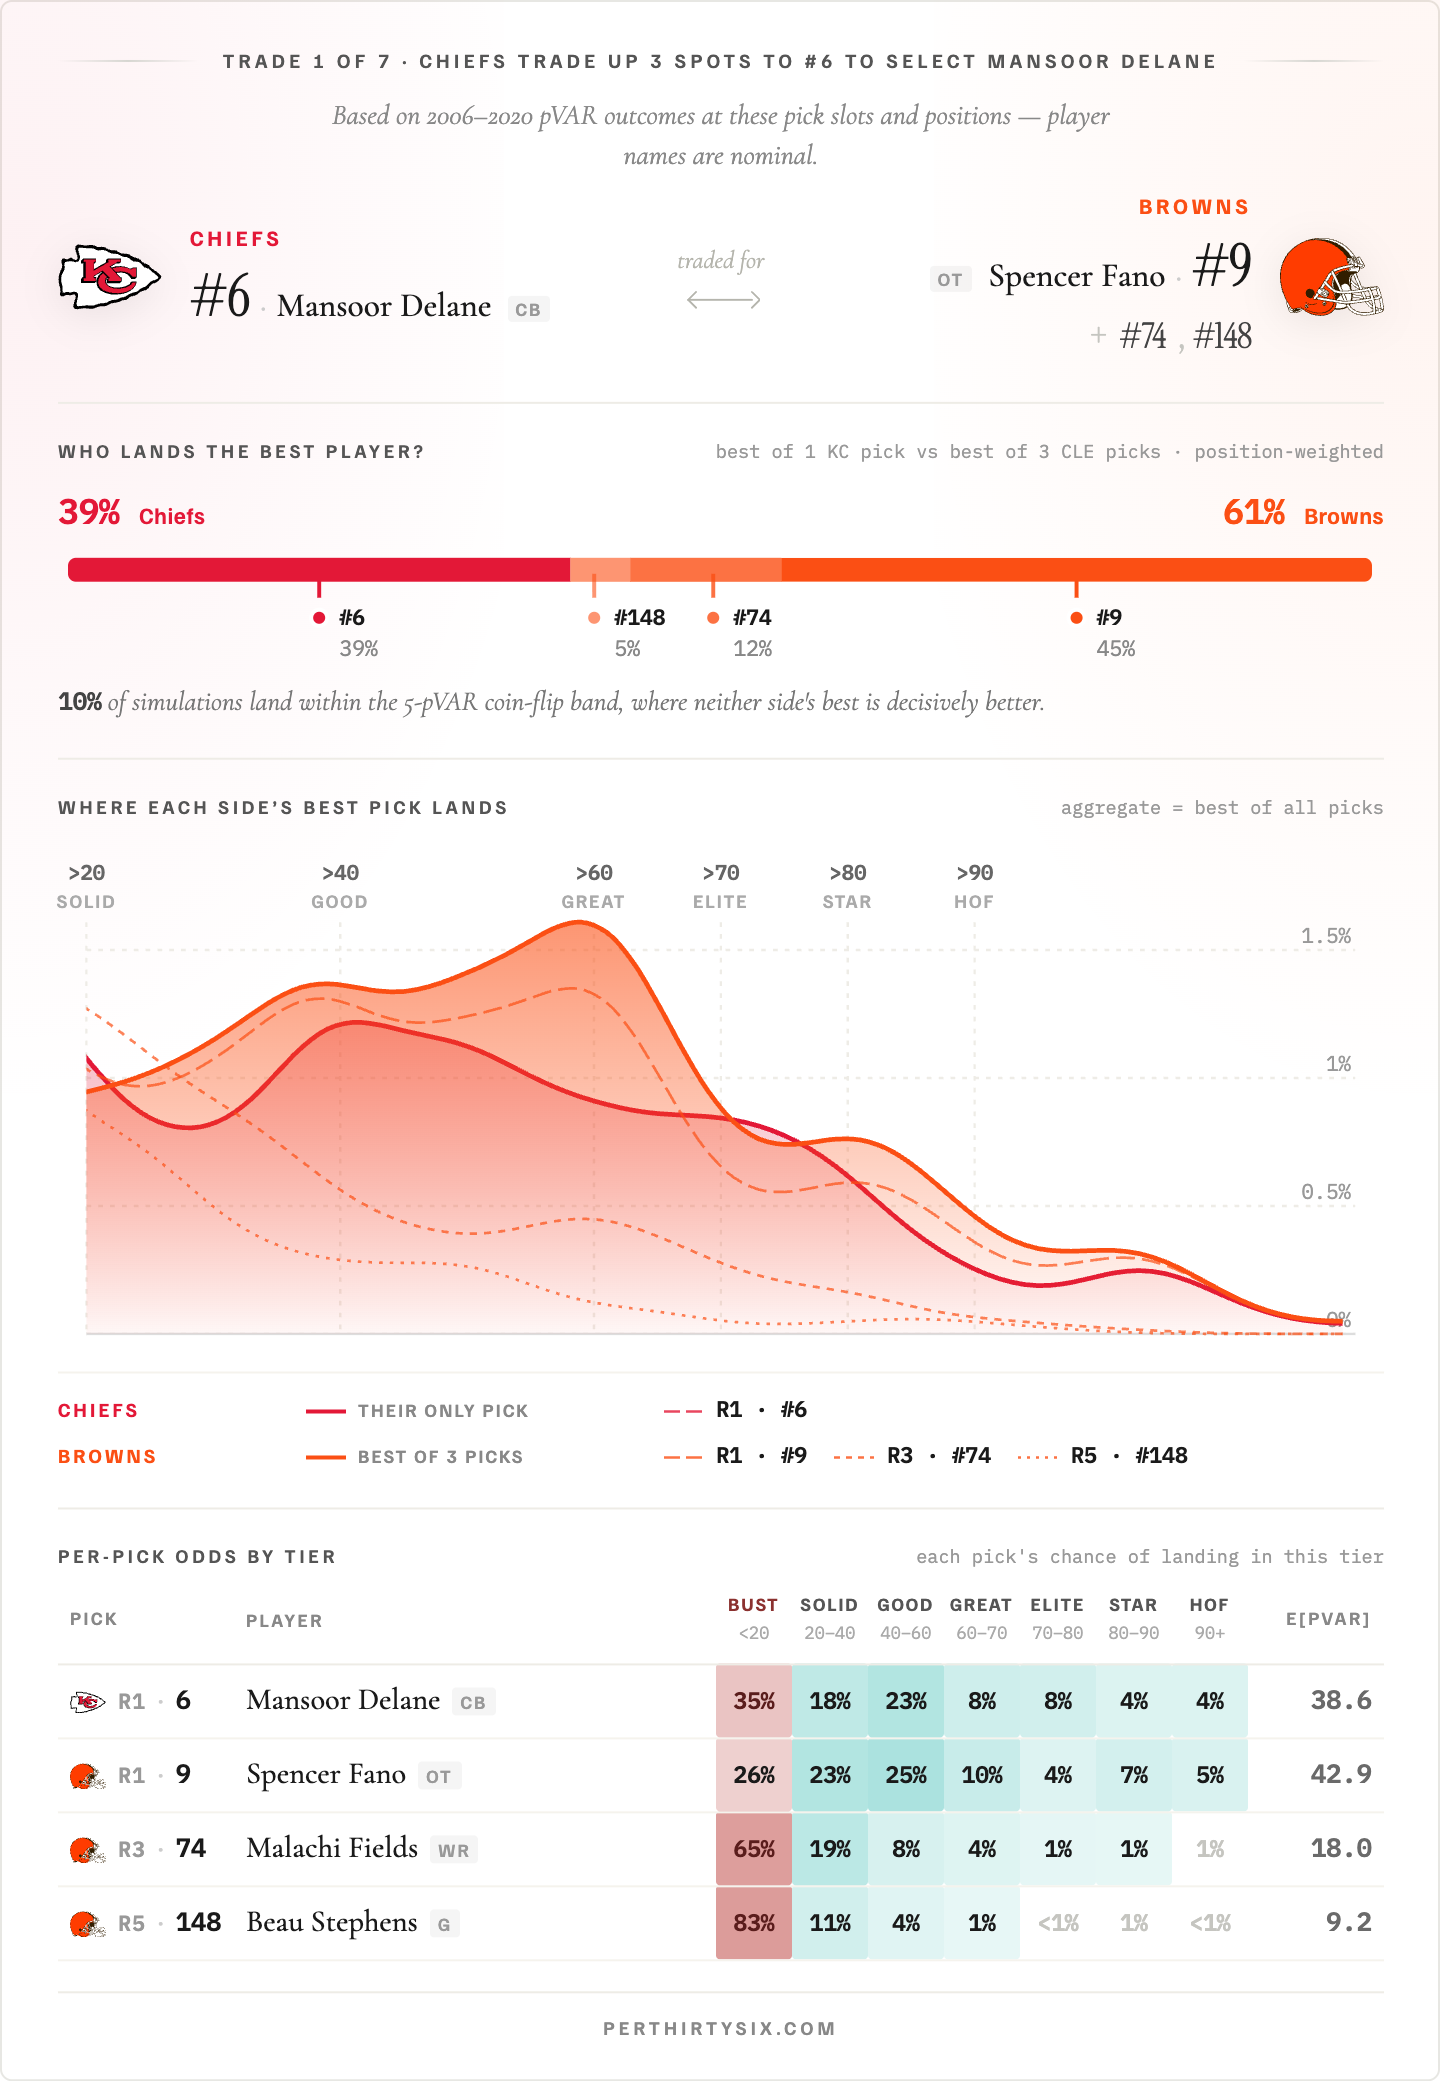
From Scoring the 2026 Draft Trades. Every pick-for-pick deal evaluated for best-player odds. — Rob |
||
|
A LETTER FROM
ShriHappy Monday! I wanted to thank everyone for the support of the How The Heck series. The three pieces have cumulatively gotten nearly 100K visitors in just the last couple of weeks, including ranking near the top of the Hacker News feed twice. I'm really grateful for all the feedback. I'm a big believer in this format of text, visuals, audio, and interactivity working together to help someone understand a concept. Richer than a Wikipedia page, but more interactive than a YouTube video. It's a lot of work to get them together, but I'm having fun experimenting with it. While I wait for the right combination of inspiration and motivation for the next one, here are some works I really enjoy by creators in the space:
Besides that, I recently turned 33! I've been in my feelings about time, as well as following the Artemis II mission, so here's a data viz about feeling small: 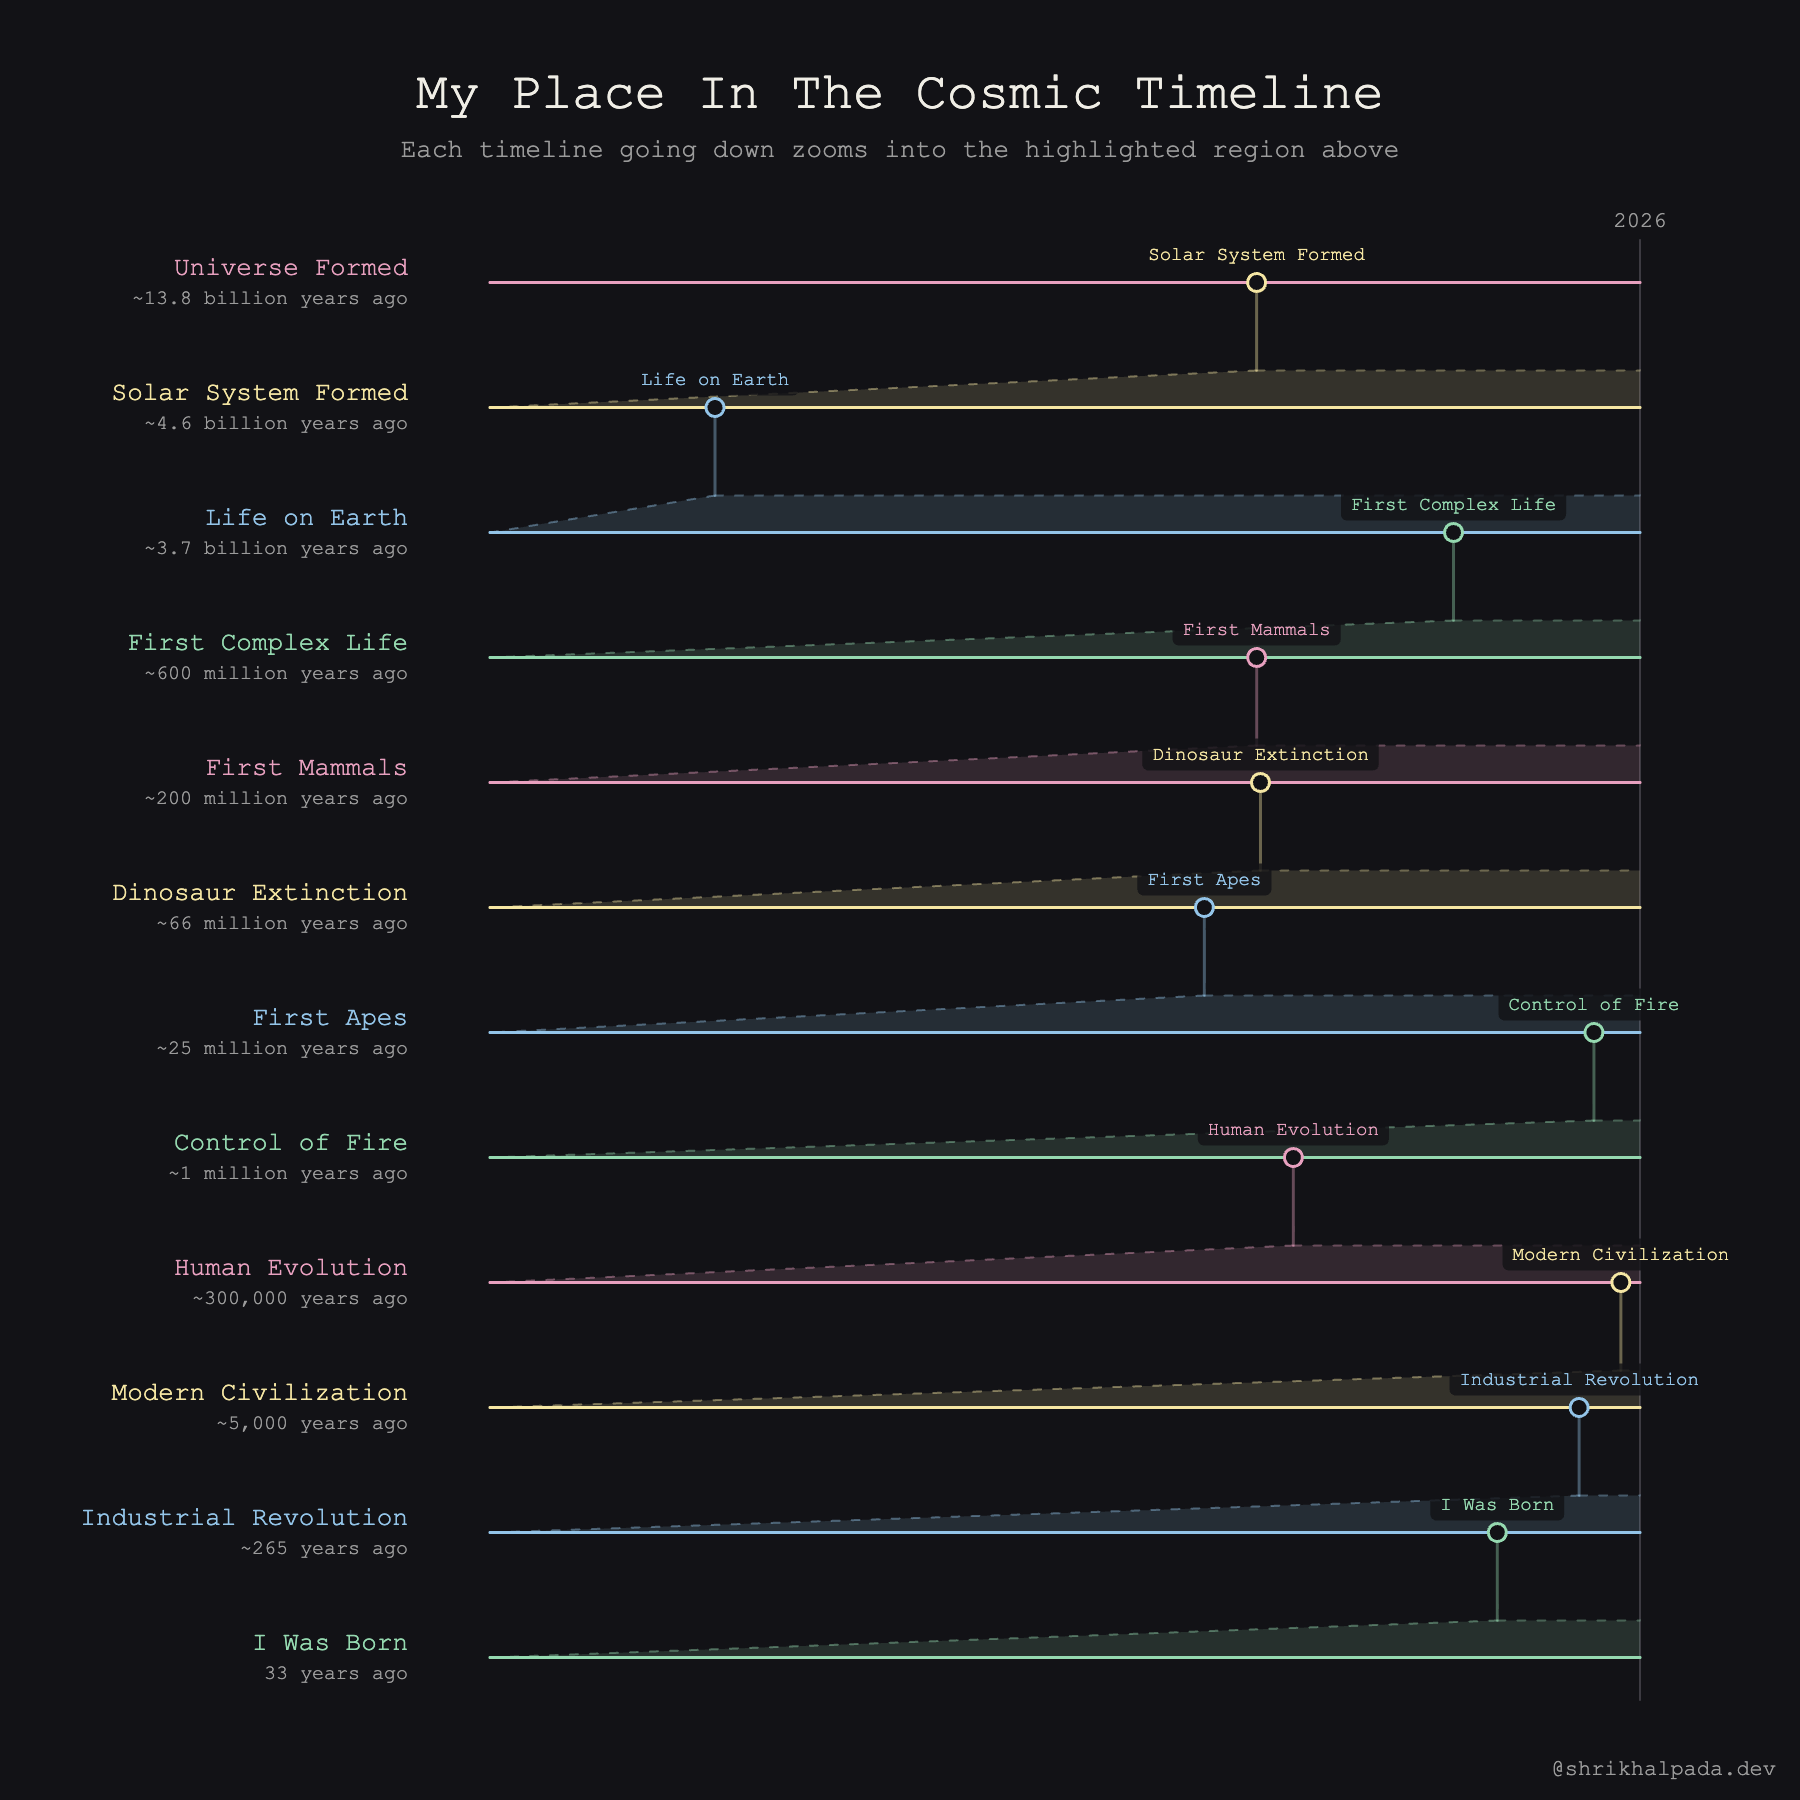
A cosmic timeline, for scale. Thanks for following along, — Shri |
||
|
A FEW SMALL THINGS
If you've been forwarded this by a friend, you can subscribe directly here. If you have a specific question for either of us to answer in a future issue, just reply — it comes straight to our inboxes. |
||
|
THANKS FOR READING.
Written by Rob & Shri ·
perthirtysix.com
|