Featured
Updates Daily •Interactive
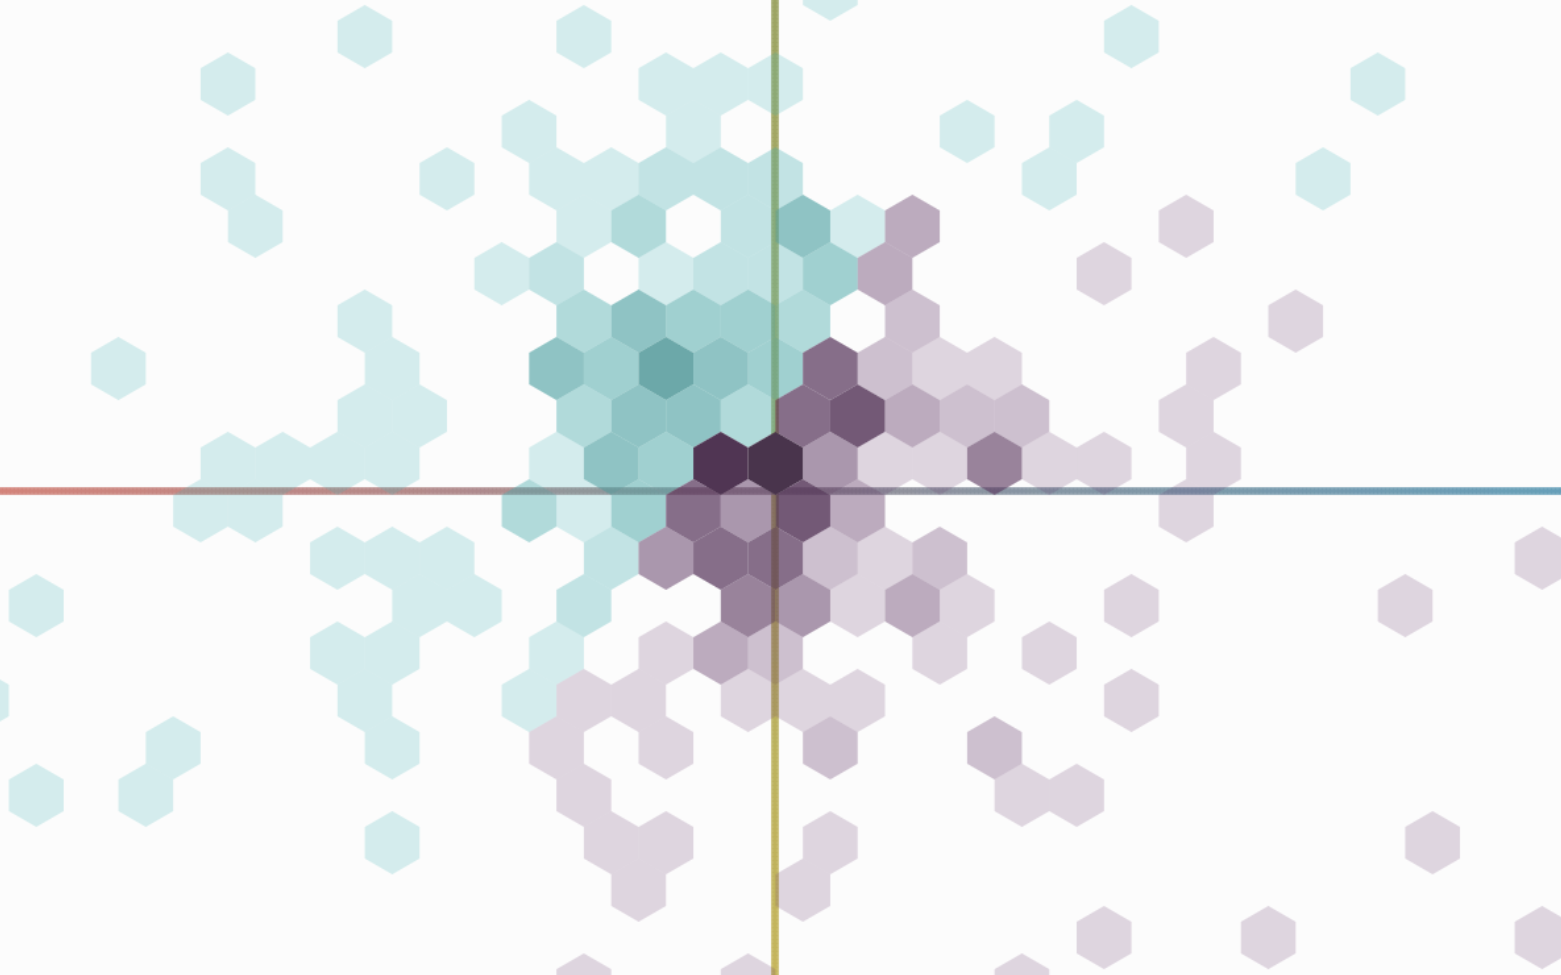
The Communal Plot
Answer a new question every day and watch as your response joins others to create a living, evolving data visualization that updates in real-time.
By Shri Khalpada and Rob Moore
Answer a new question every day and watch as your response joins others to create a living, evolving data visualization that updates in real-time.
By Shri Khalpada and Rob Moore
PLAYAnswer a new question every day and watch as your response joins others to create a living, evolving data visualization that updates in real-time.
By Shri Khalpada & Rob Moore
 PLAY
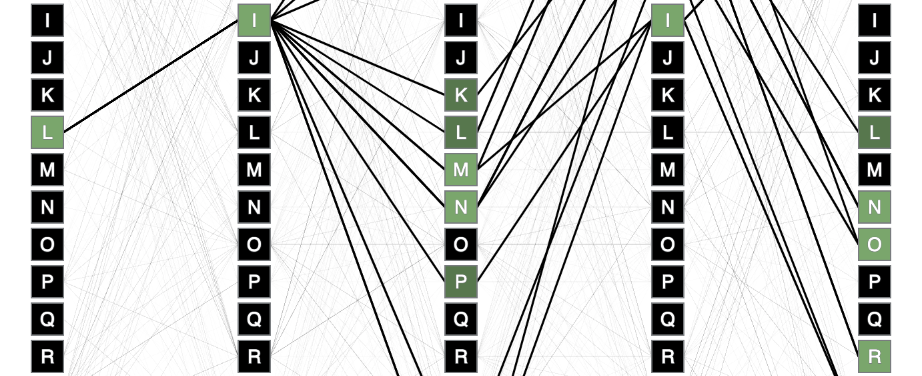
PLAYAll 2,309 words interactively laid out
By Shri Khalpada
 PLAY
PLAYExplore 9 generations of Pokémon. Filter by type and stats, and scout any Pokémon by using the interactive visualization.
By Shri Khalpada
 PLAY
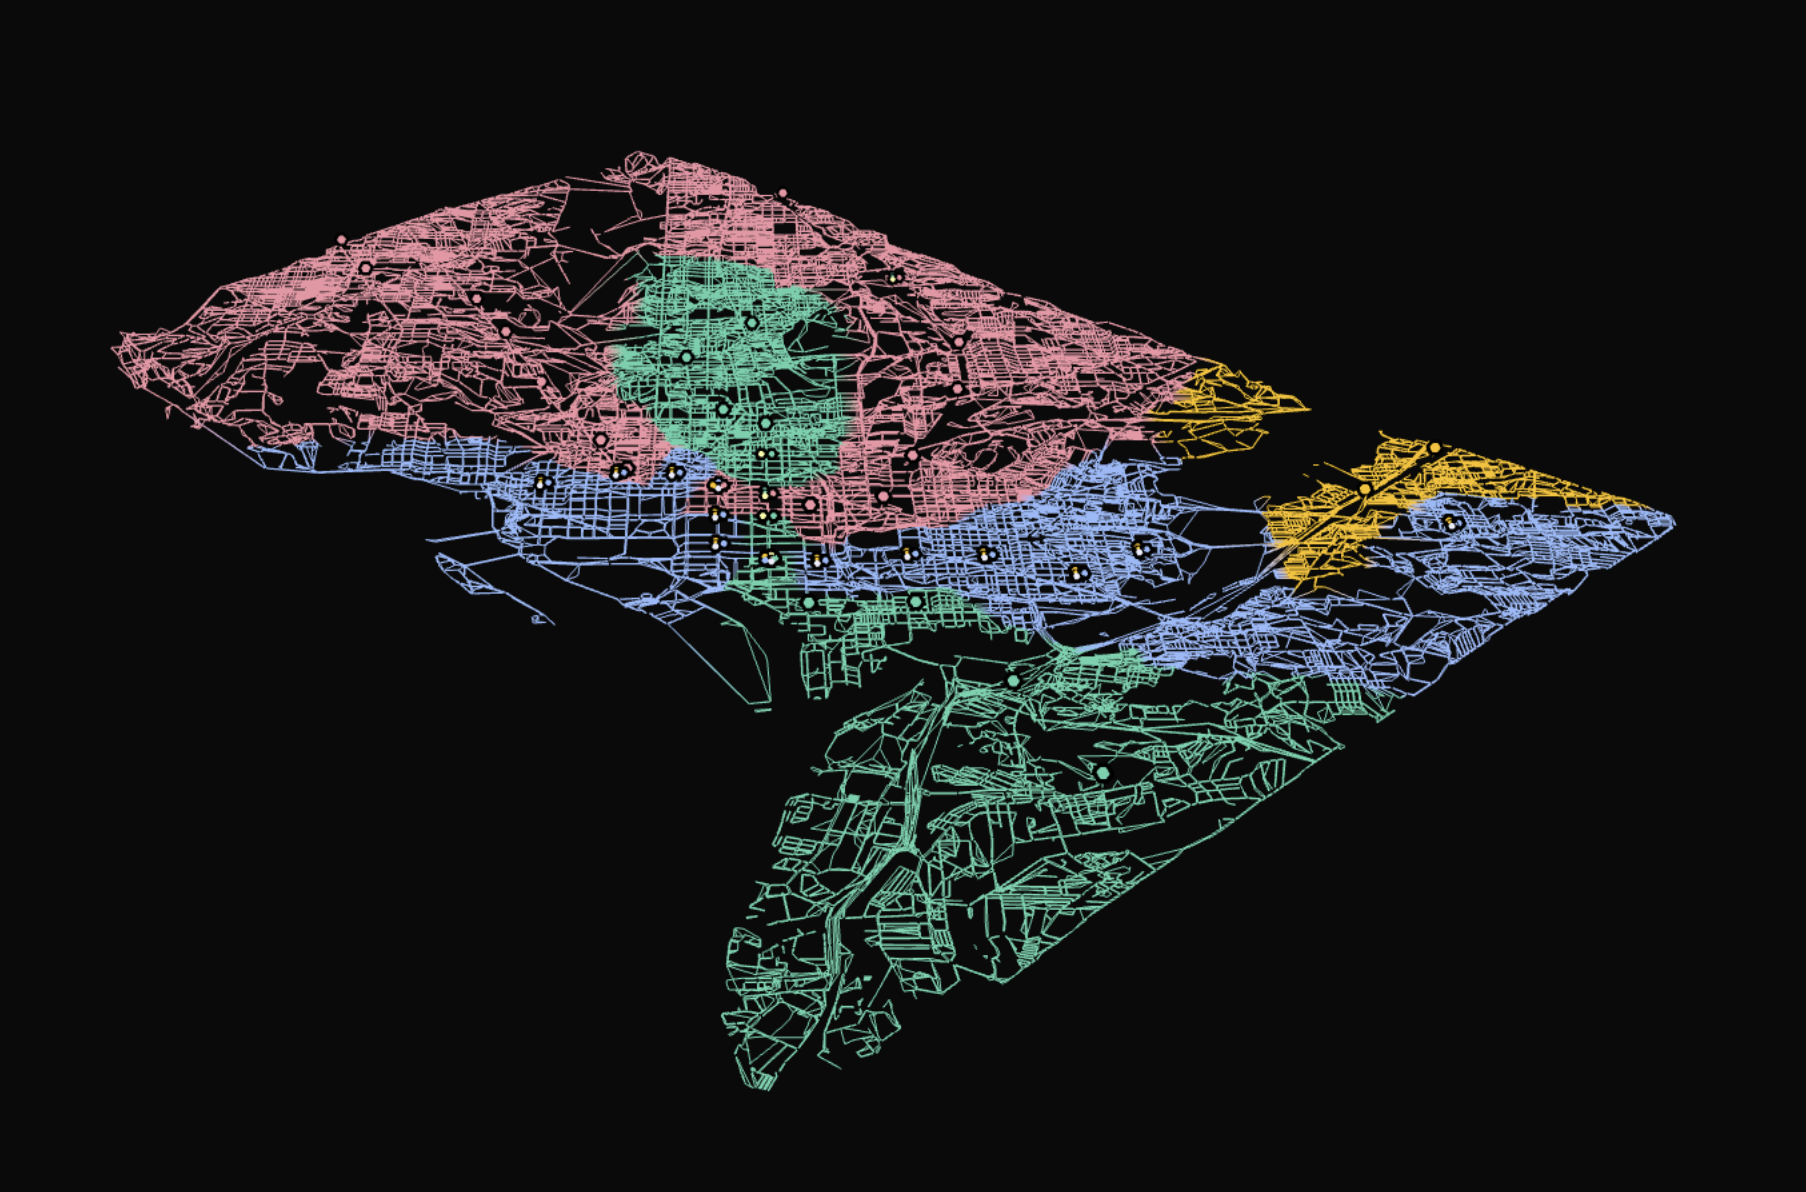
PLAYAn interactive 3D view of the roads and metro stations of Washington, DC
By Shri Khalpada
 PLAY
PLAYTest your rhythm and timing in Drumroll! Press keys faster and faster to achieve the highest score. How many presses can you achieve before the sequence breaks?
By Rob Moore
 PLAY
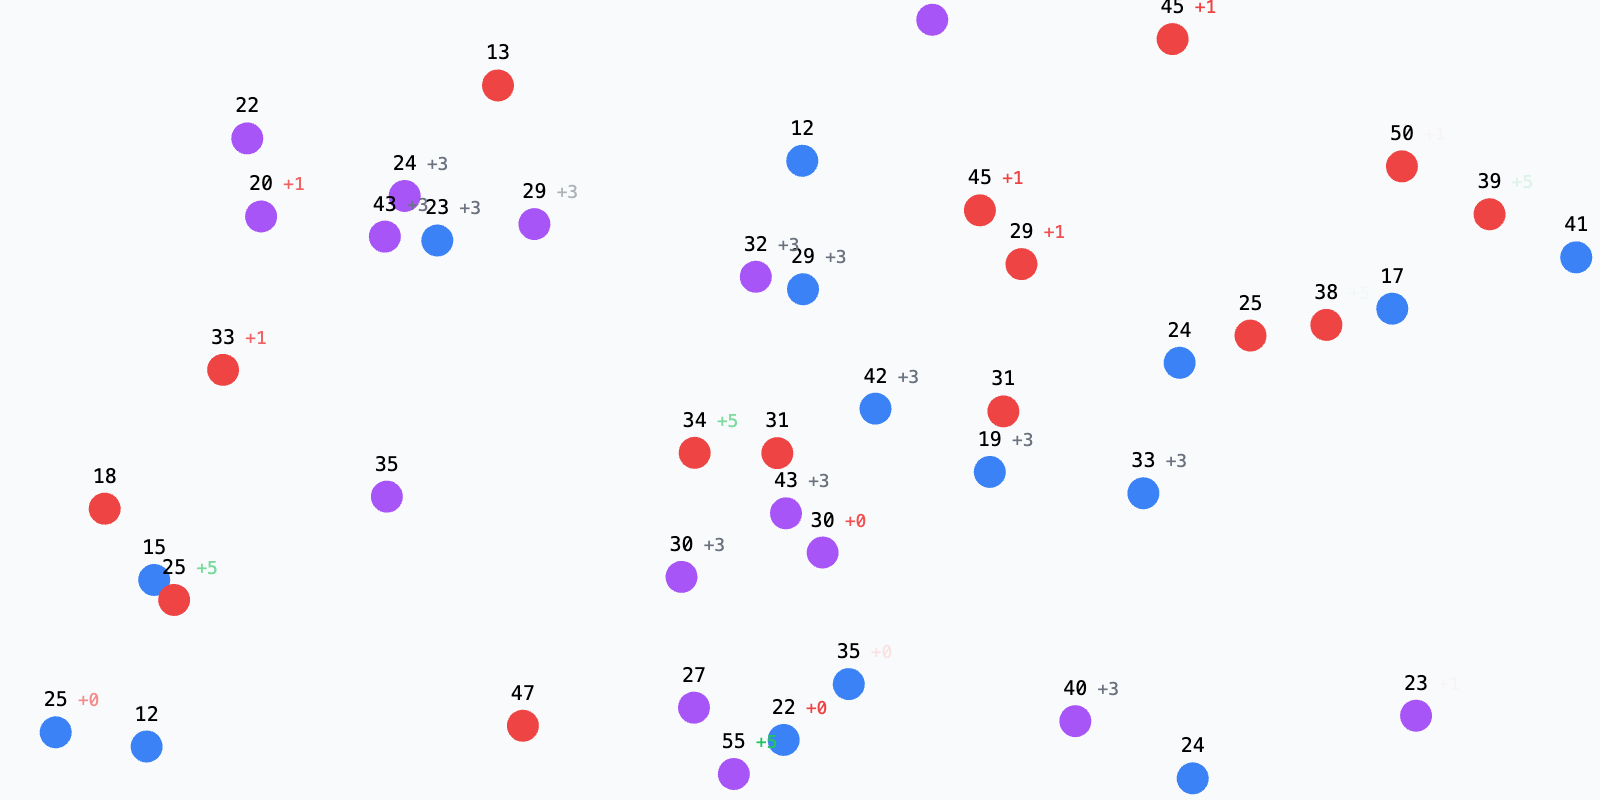
PLAYExploring streaks on Jeopardy since the 5-day win cap was removed
By Shri Khalpada
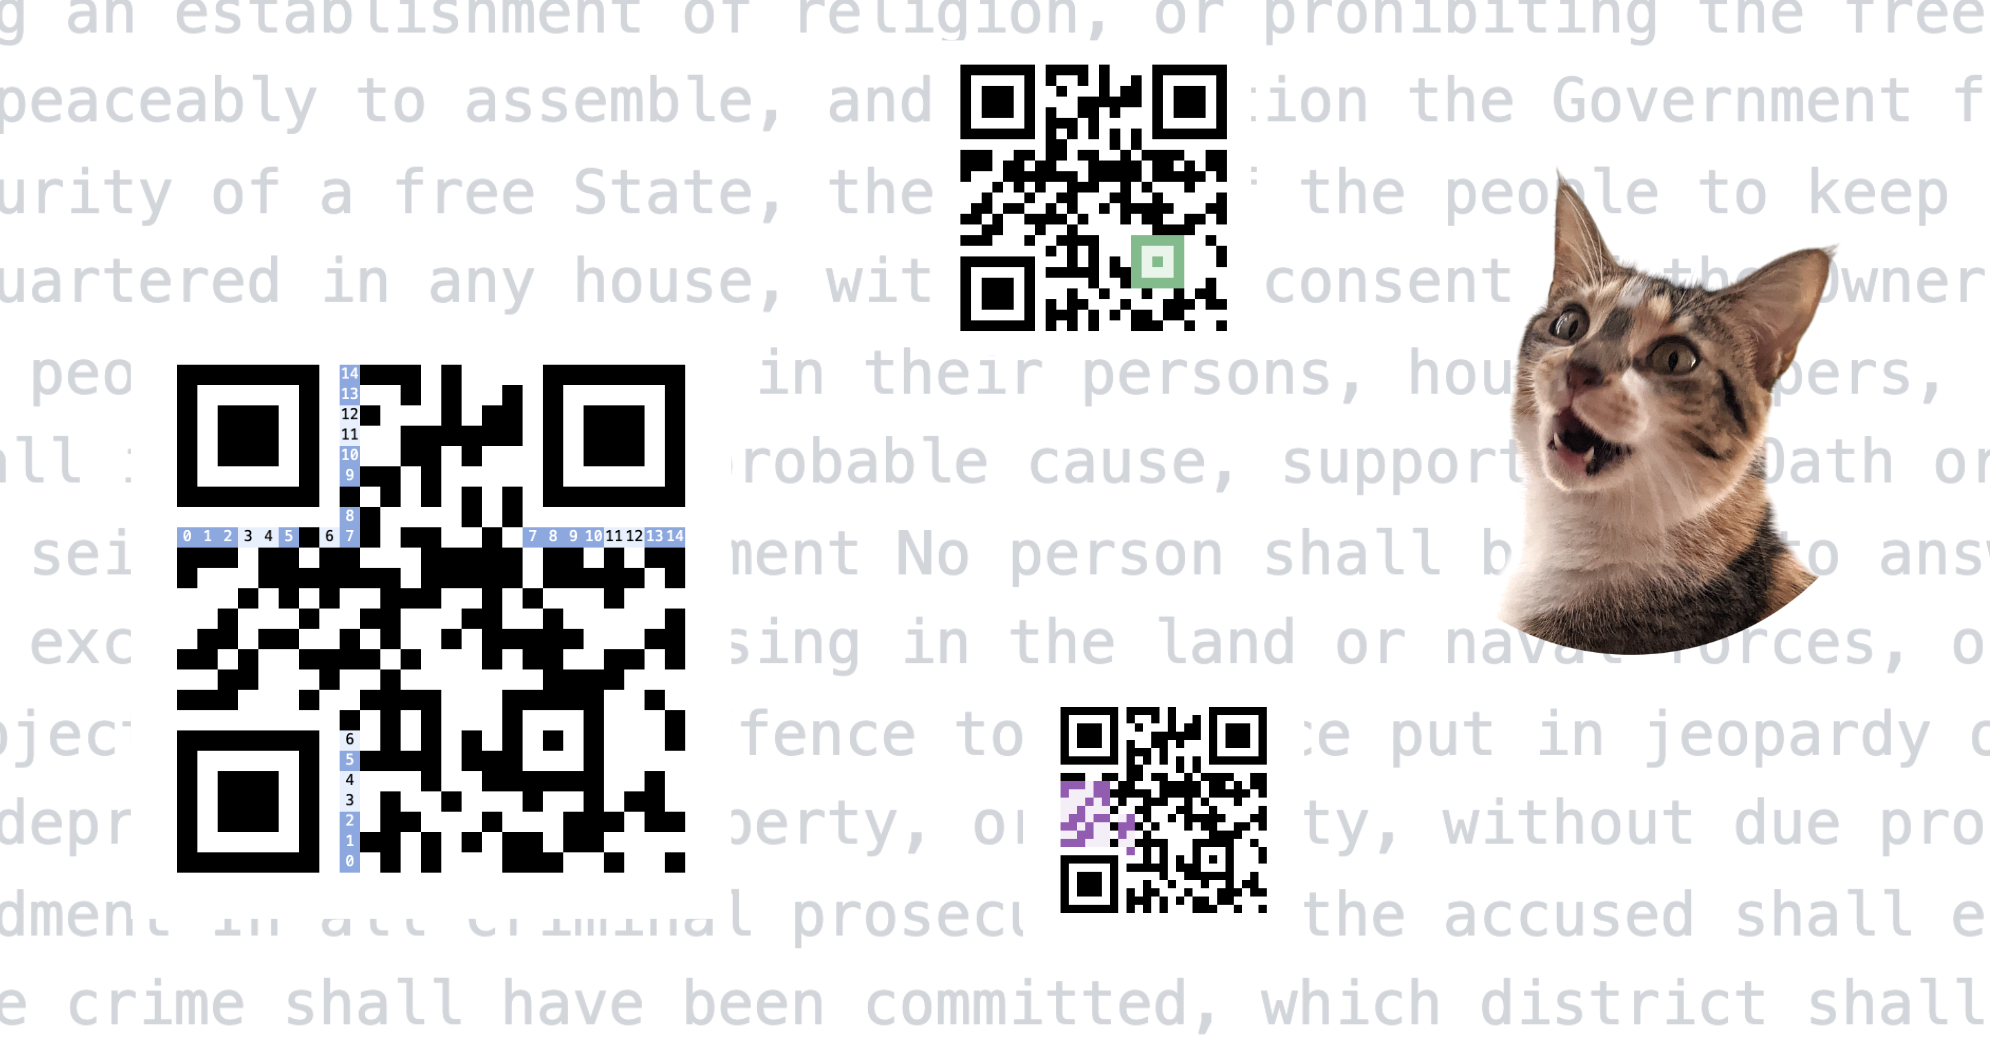 LEARN
LEARNAn interactive exploration of QR codes and how they work
By Shri Khalpada
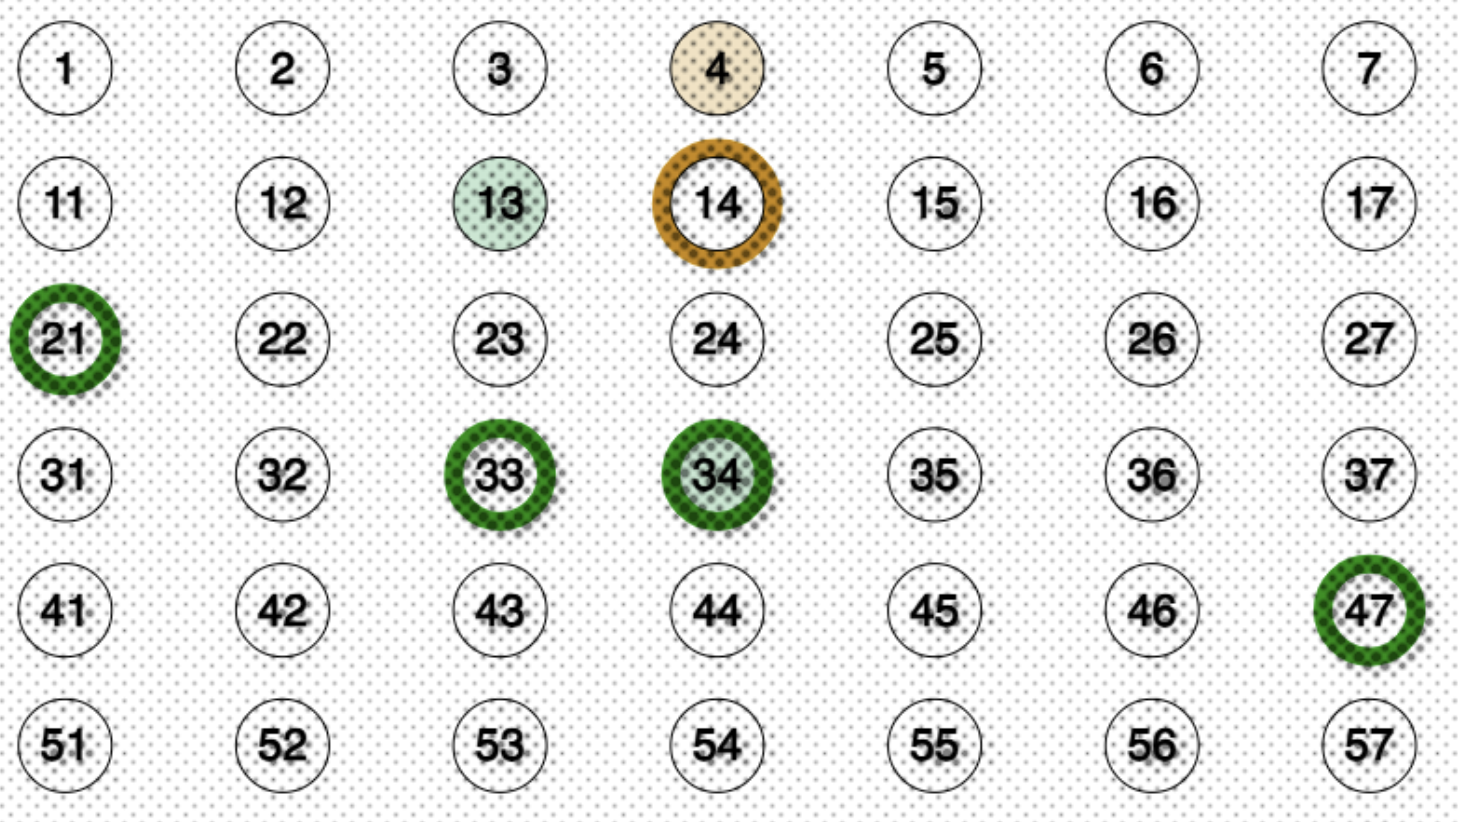 LEARN
LEARNInteractively explore lottery probabilities and simulate thousands of tickets in seconds
By Shri Khalpada
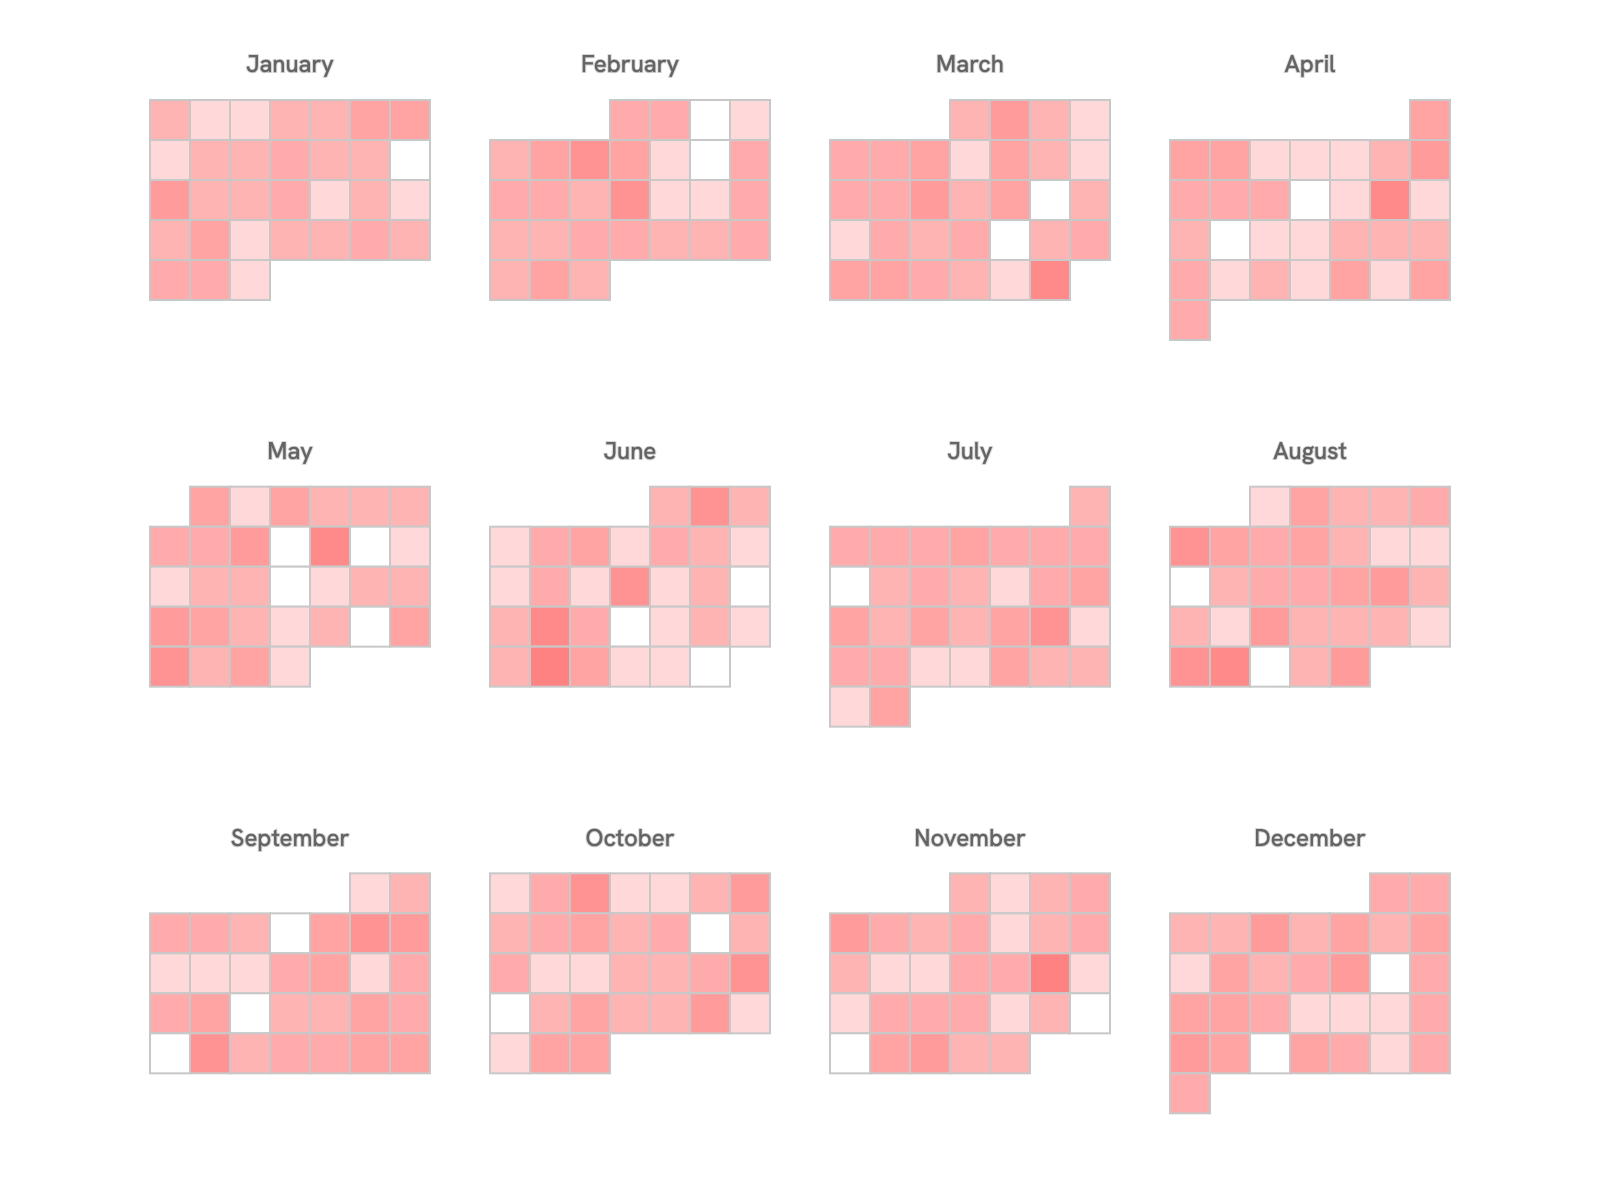 LEARN
LEARNSimulate the probabilities of shared birthdays in a group
By Shri Khalpada
 LEARN
LEARNVisualize elevation data with a 3D globe
By Shri Khalpada
 LEARN
LEARNTo betray, or not to betray?
By Shri Khalpada
 LEARN
LEARNInteractively explore how different voting systems can yield different outcomes
By Shri Khalpada
 NBA
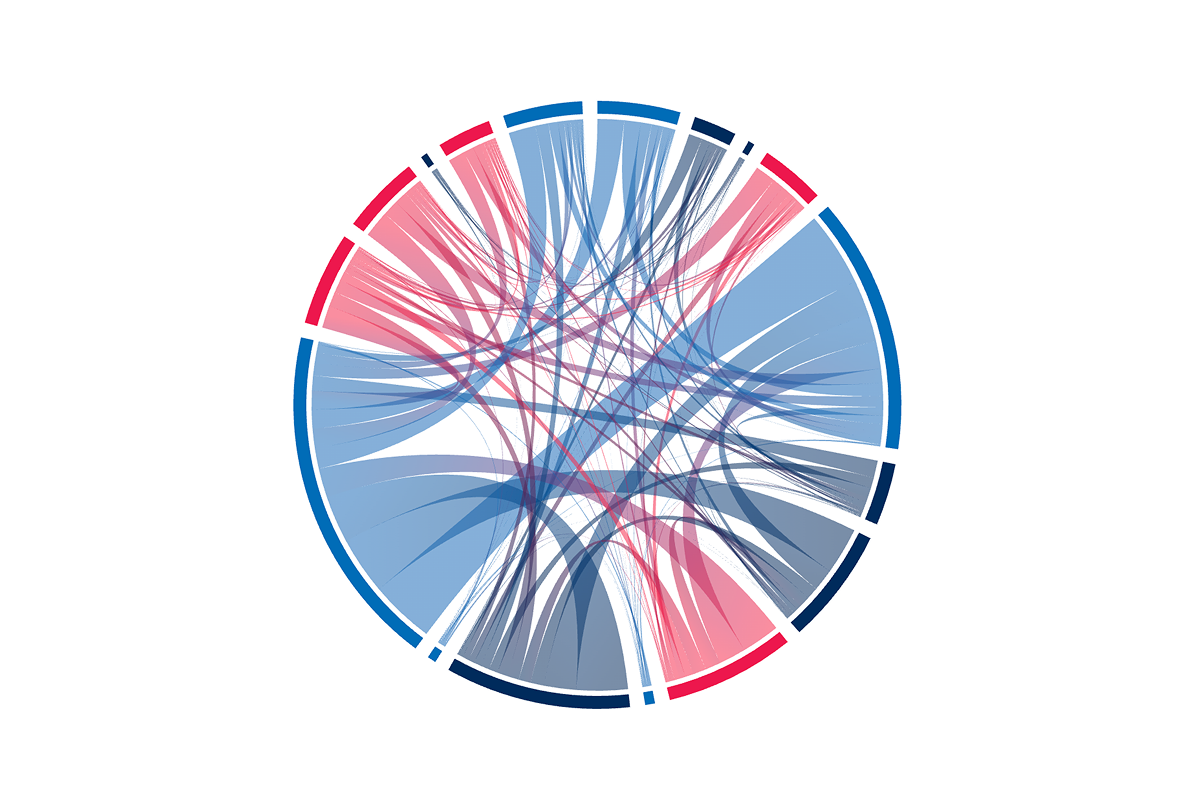
NBAA way to visualize passing on your favorite NBA team
By Shri Khalpada & Rob Moore
 NBA
NBACreate highly customized and interactive shot charts for the NBA
By Shri Khalpada & Rob Moore
 NBA
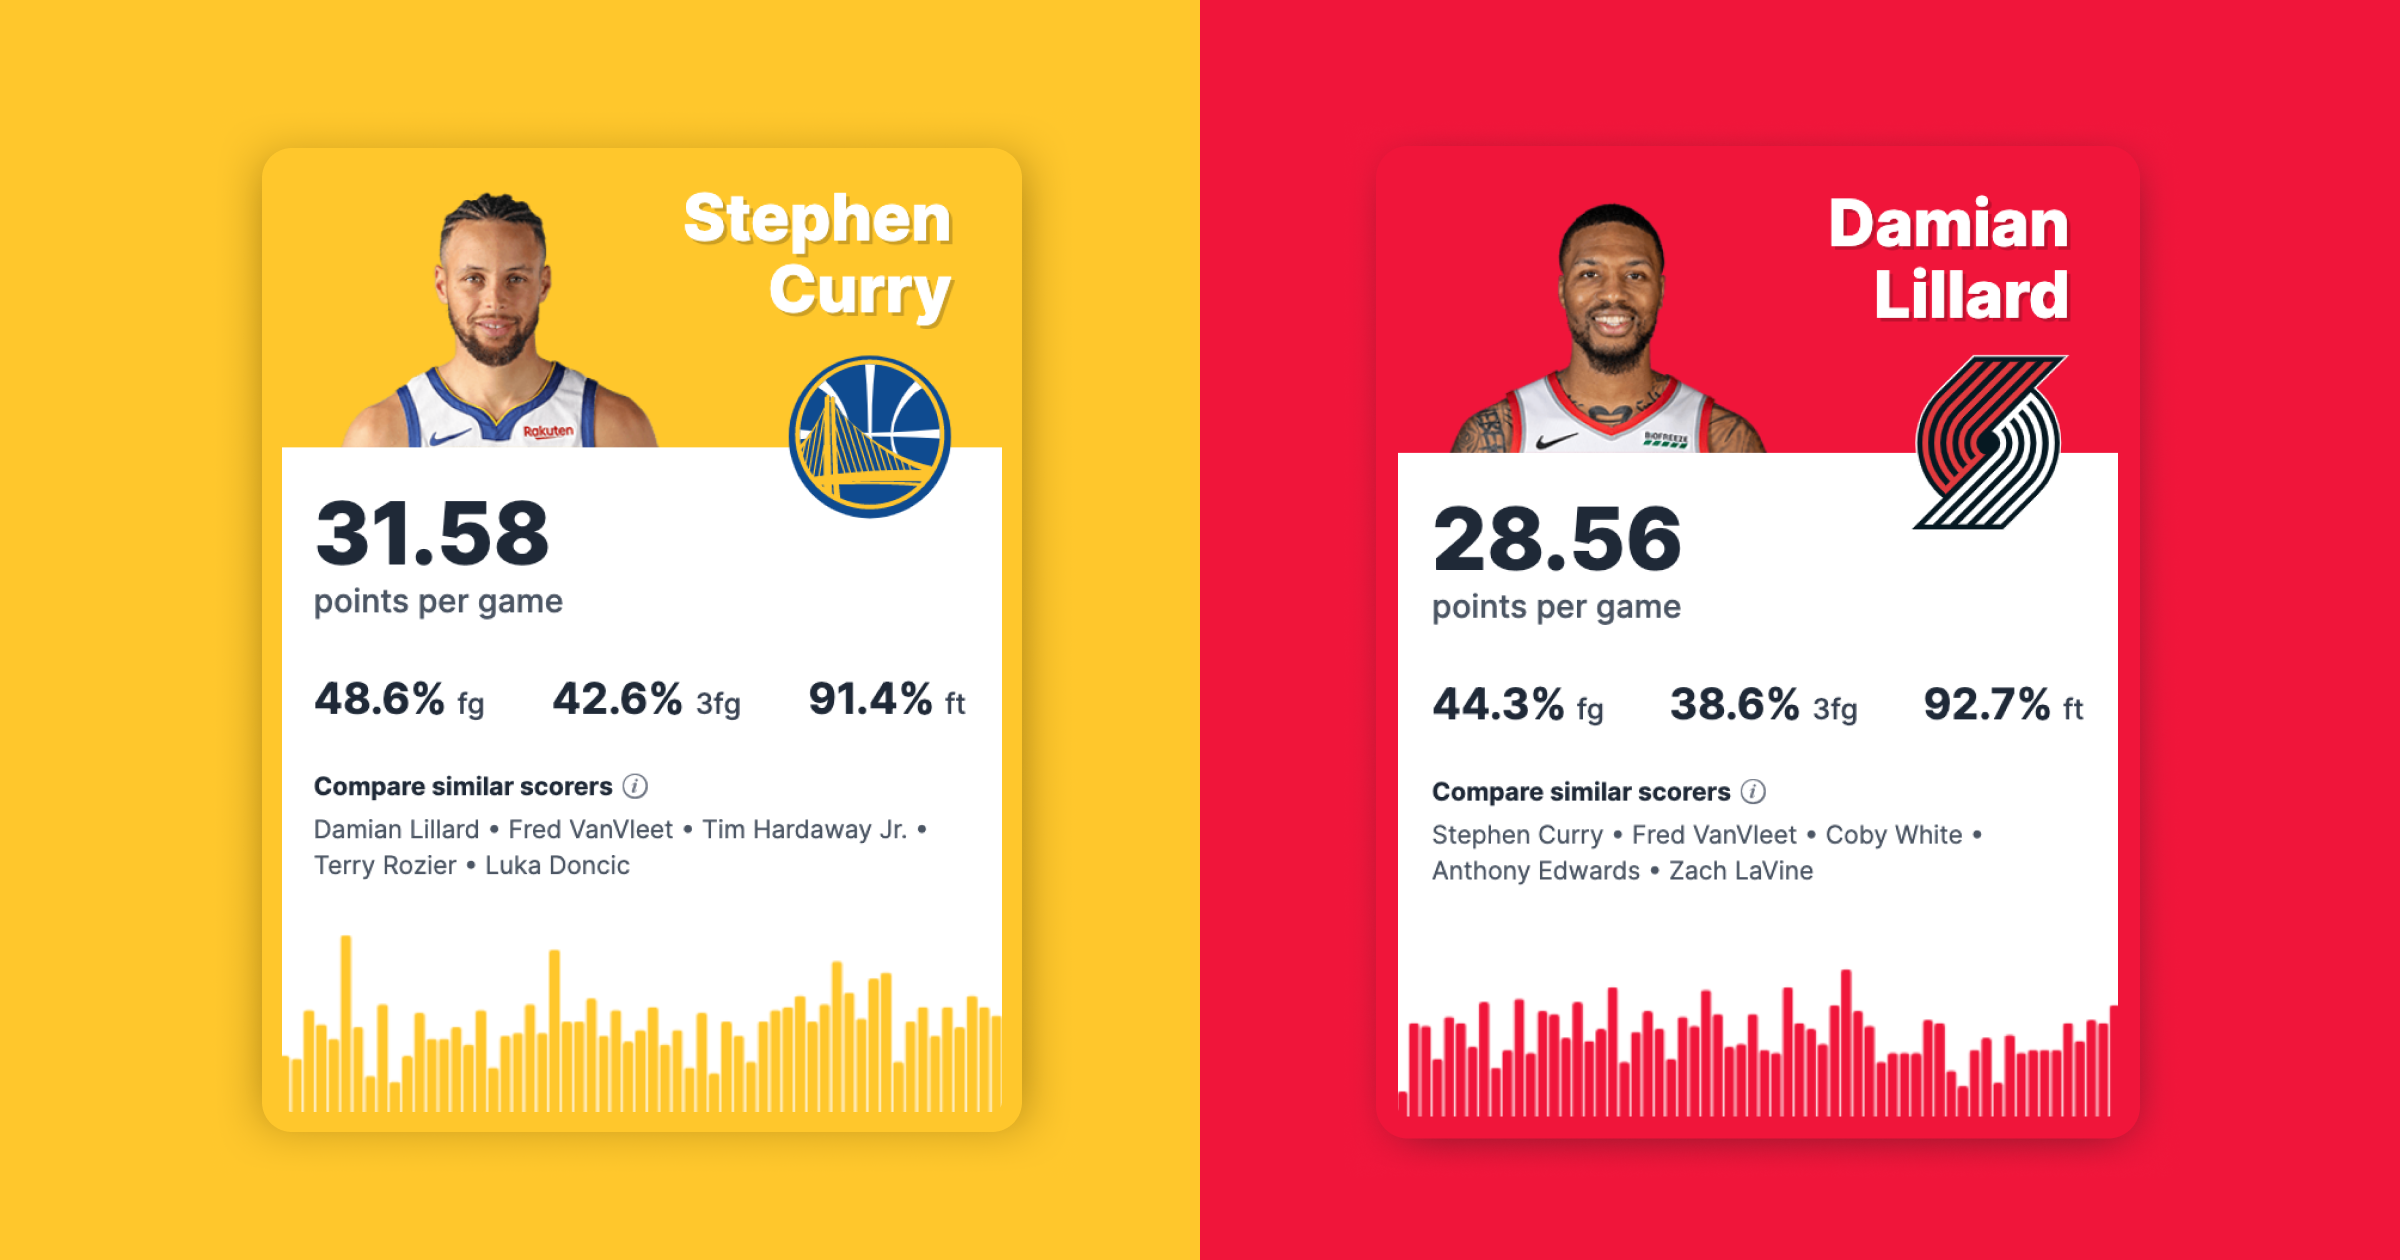
NBADesign your own metric for ranking the best players in the NBA
By Shri Khalpada & Rob Moore
 NBA
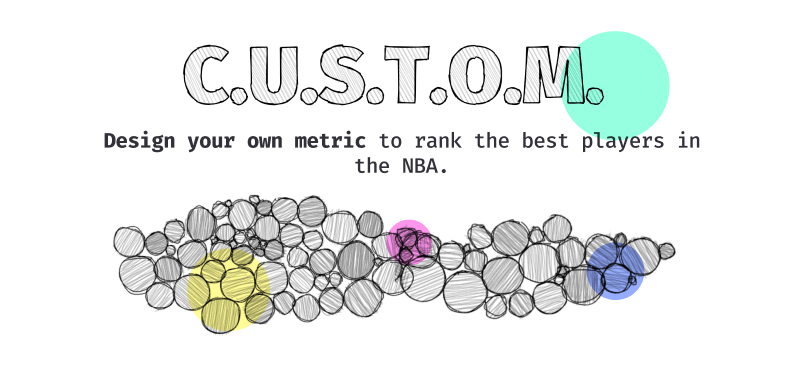
NBADesign your own metric to capture the things that don't normally show up on the box score
By Rob Moore & Shri Khalpada
 NBA
NBAThe number of fans allowed at each stadium in the 2021 NBA Playoffs
By Rob Moore
 NBA
NBABuilding a machine learning model to predict the future and evaluate the past of the NBA's most valuable players
By Rob Moore
 NBA
NBASome non-trivial tips to win your NCAA Tournament prediction pool.
By Rob Moore
 NBA
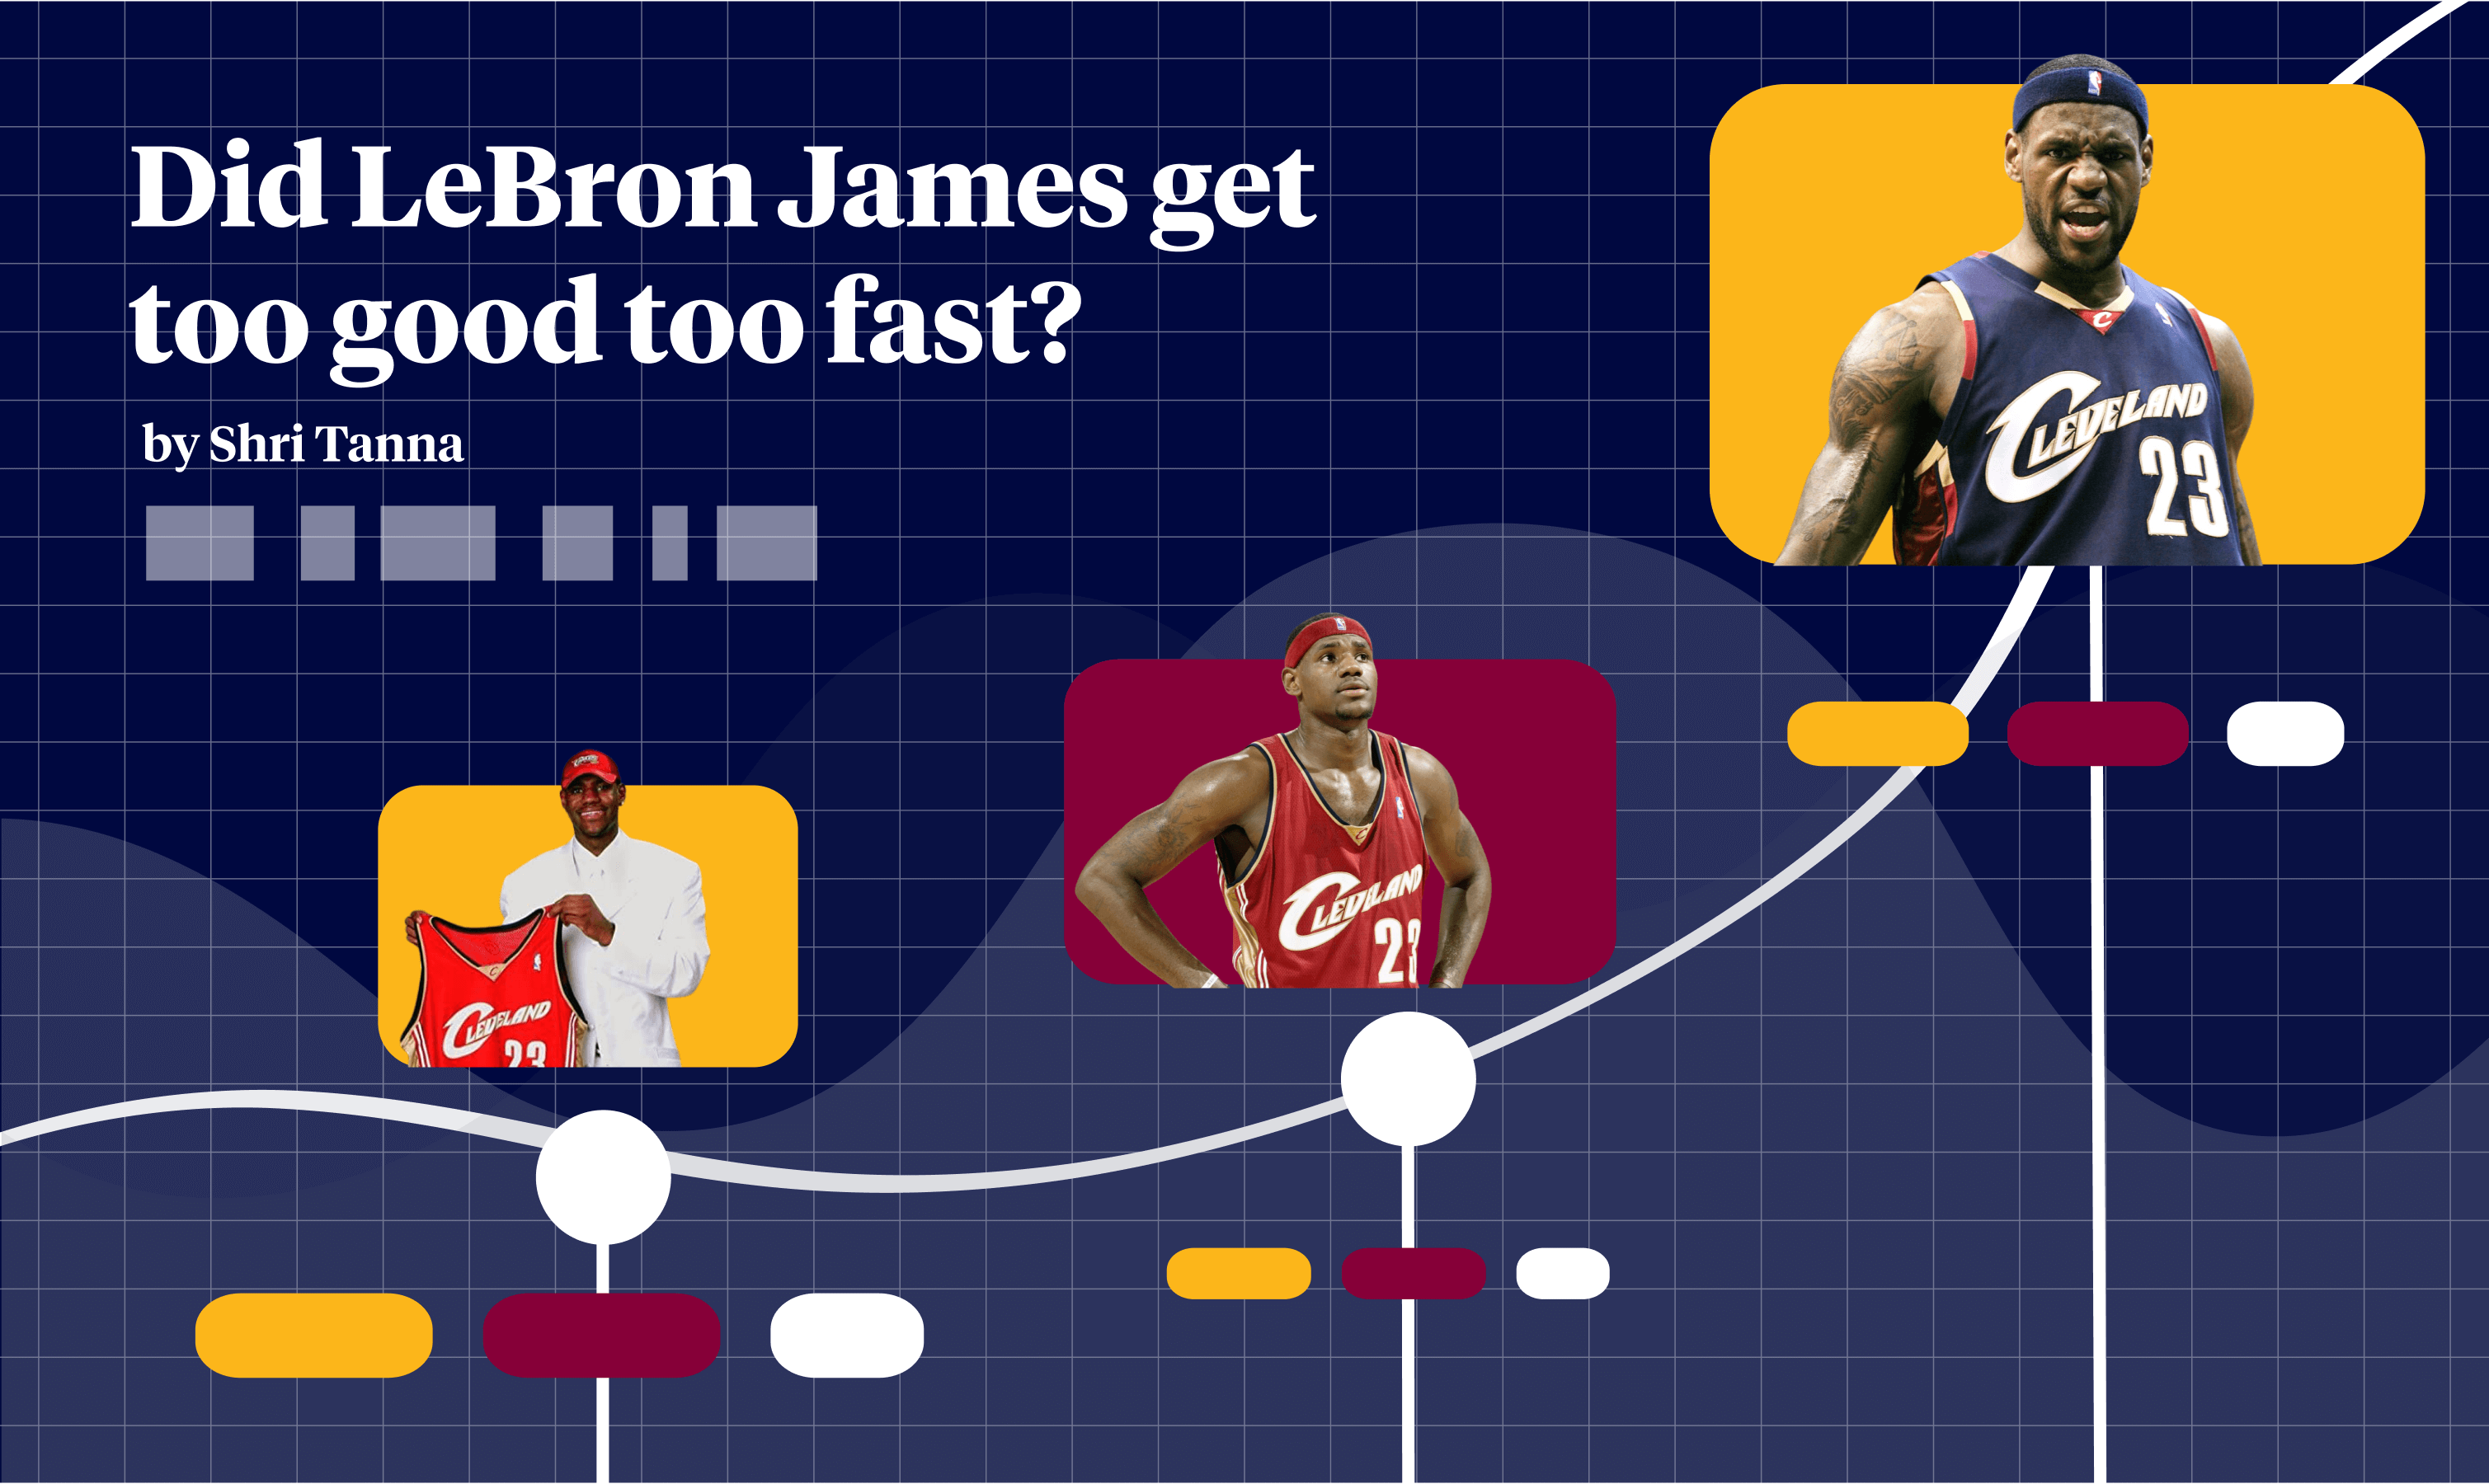
NBAA retrospective and thought experiment on LeBron James' first Cleveland stint
By Shri Khalpada
 NBA
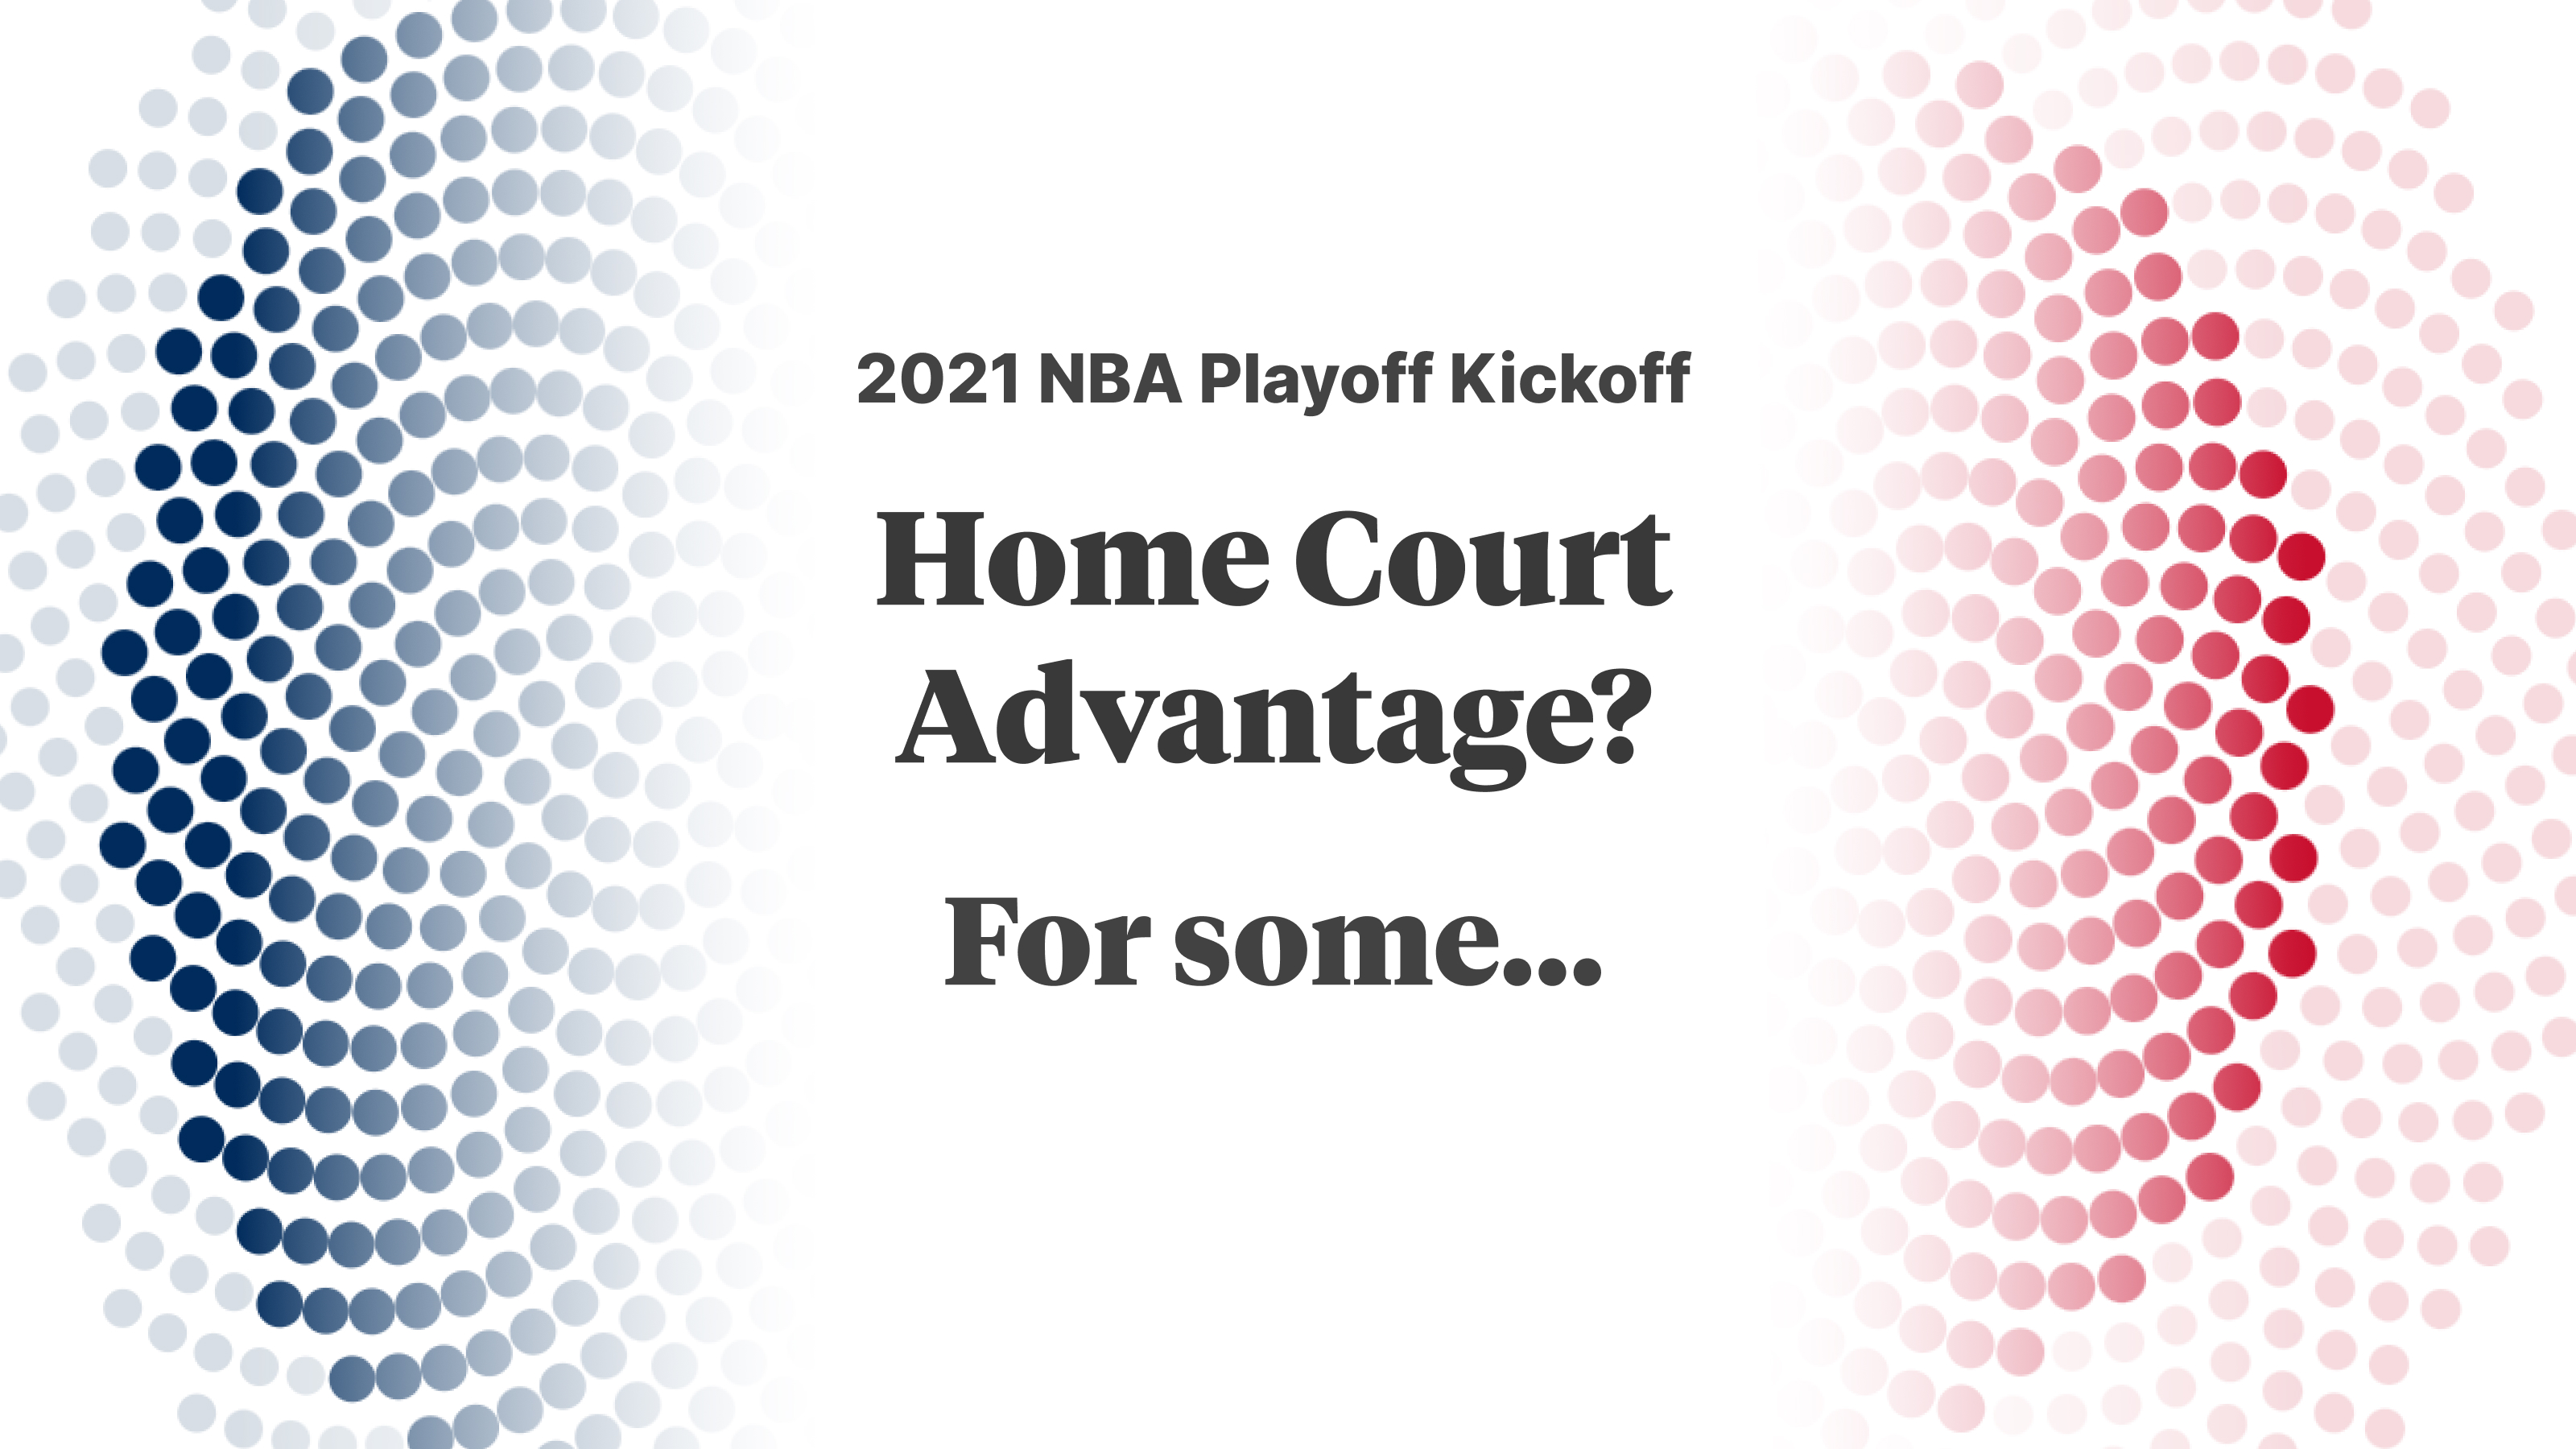
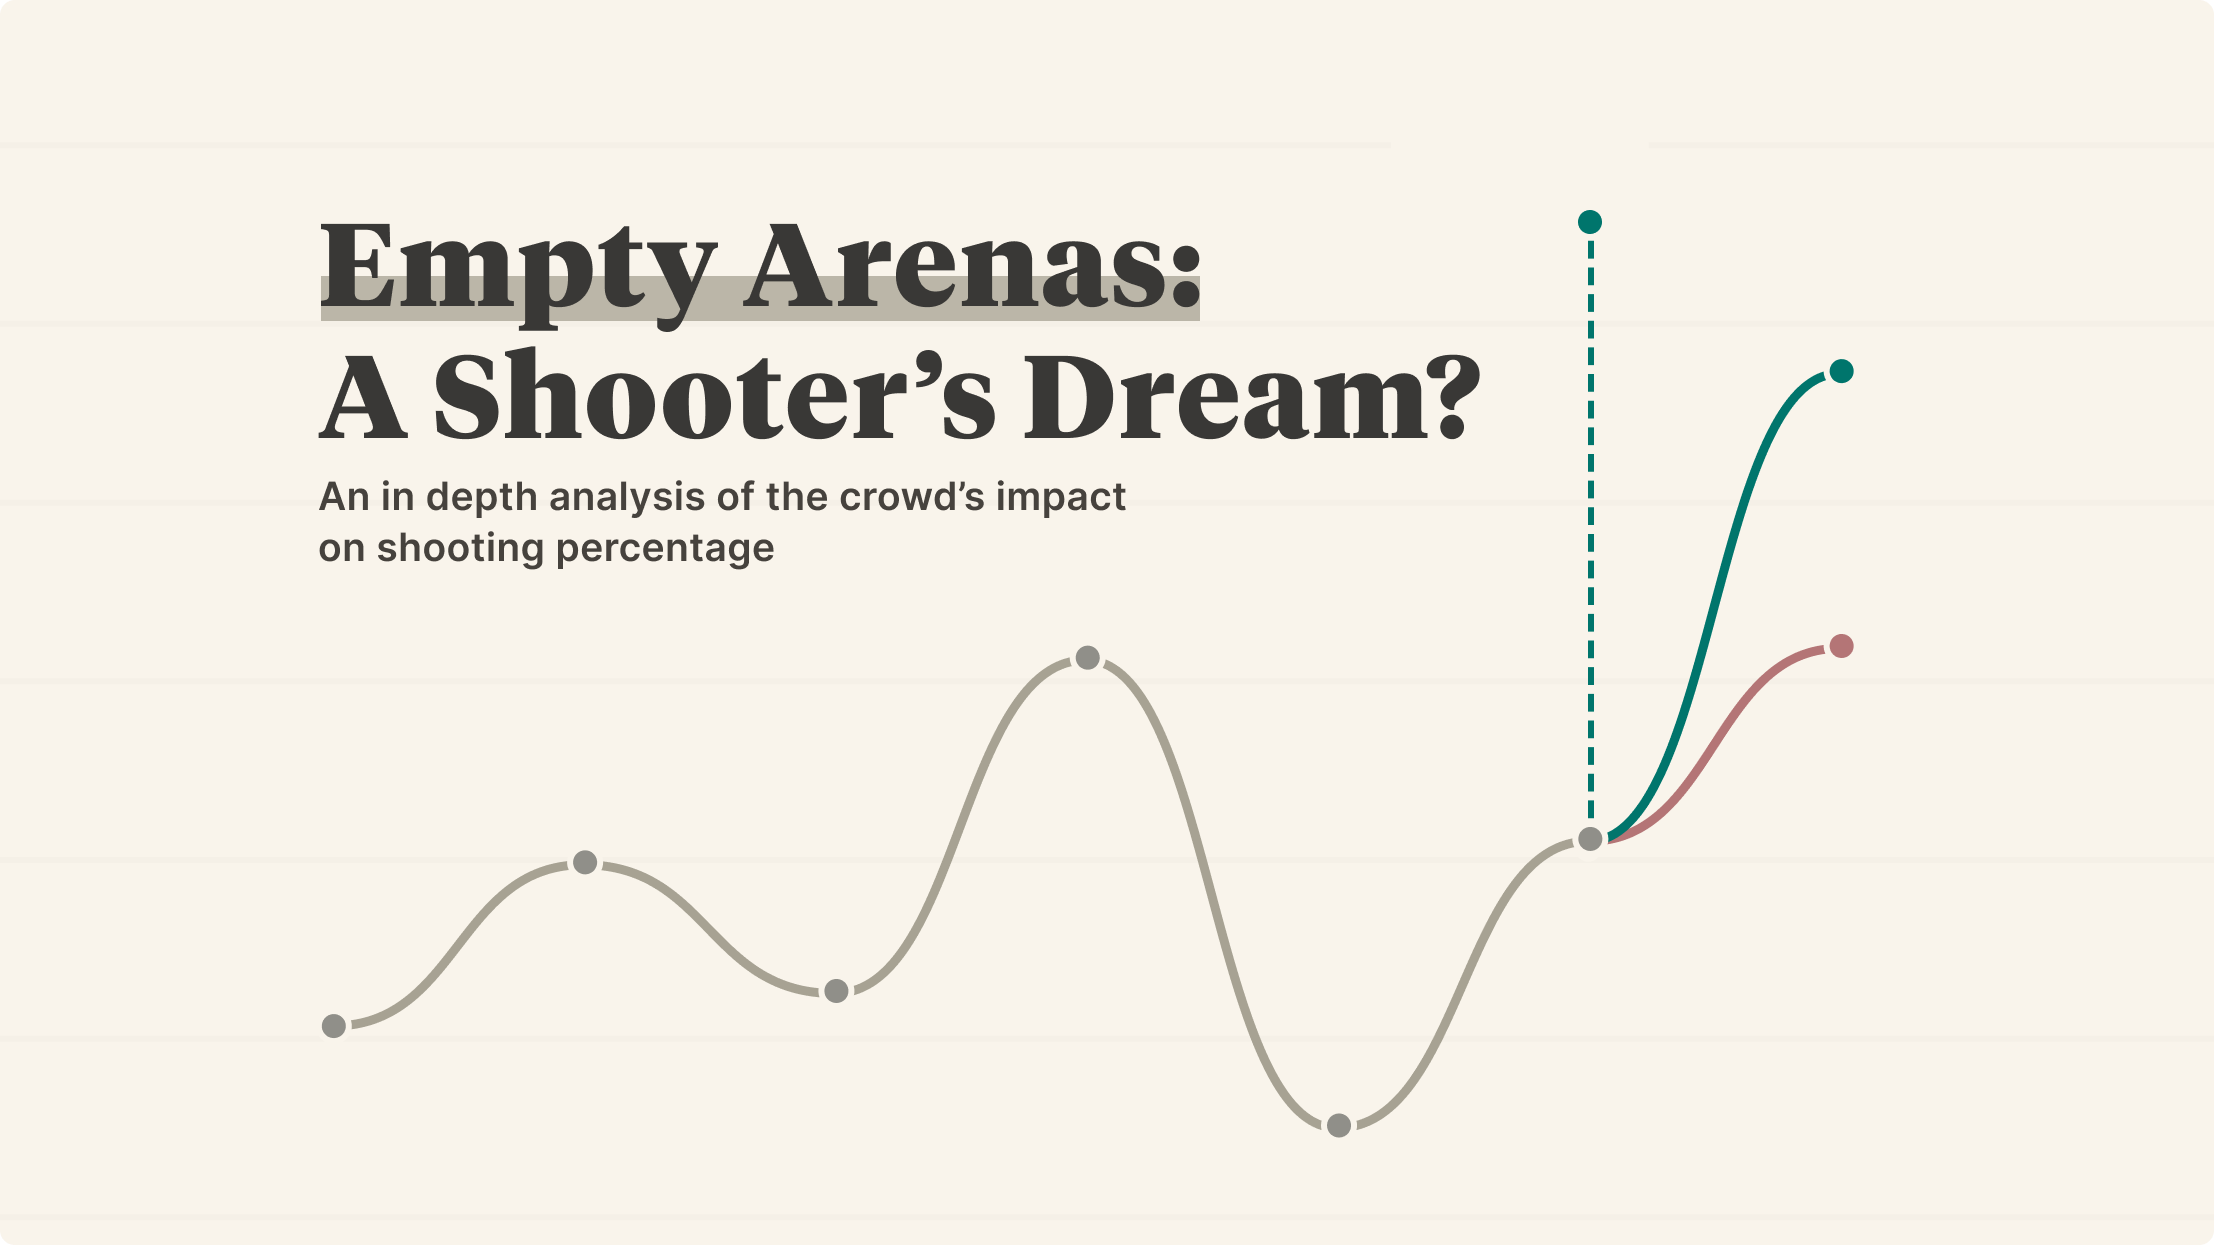
NBAAn in depth analysis of a crowd's impact on shooting percentage
By Shri Khalpada & Rob Moore
 NFL
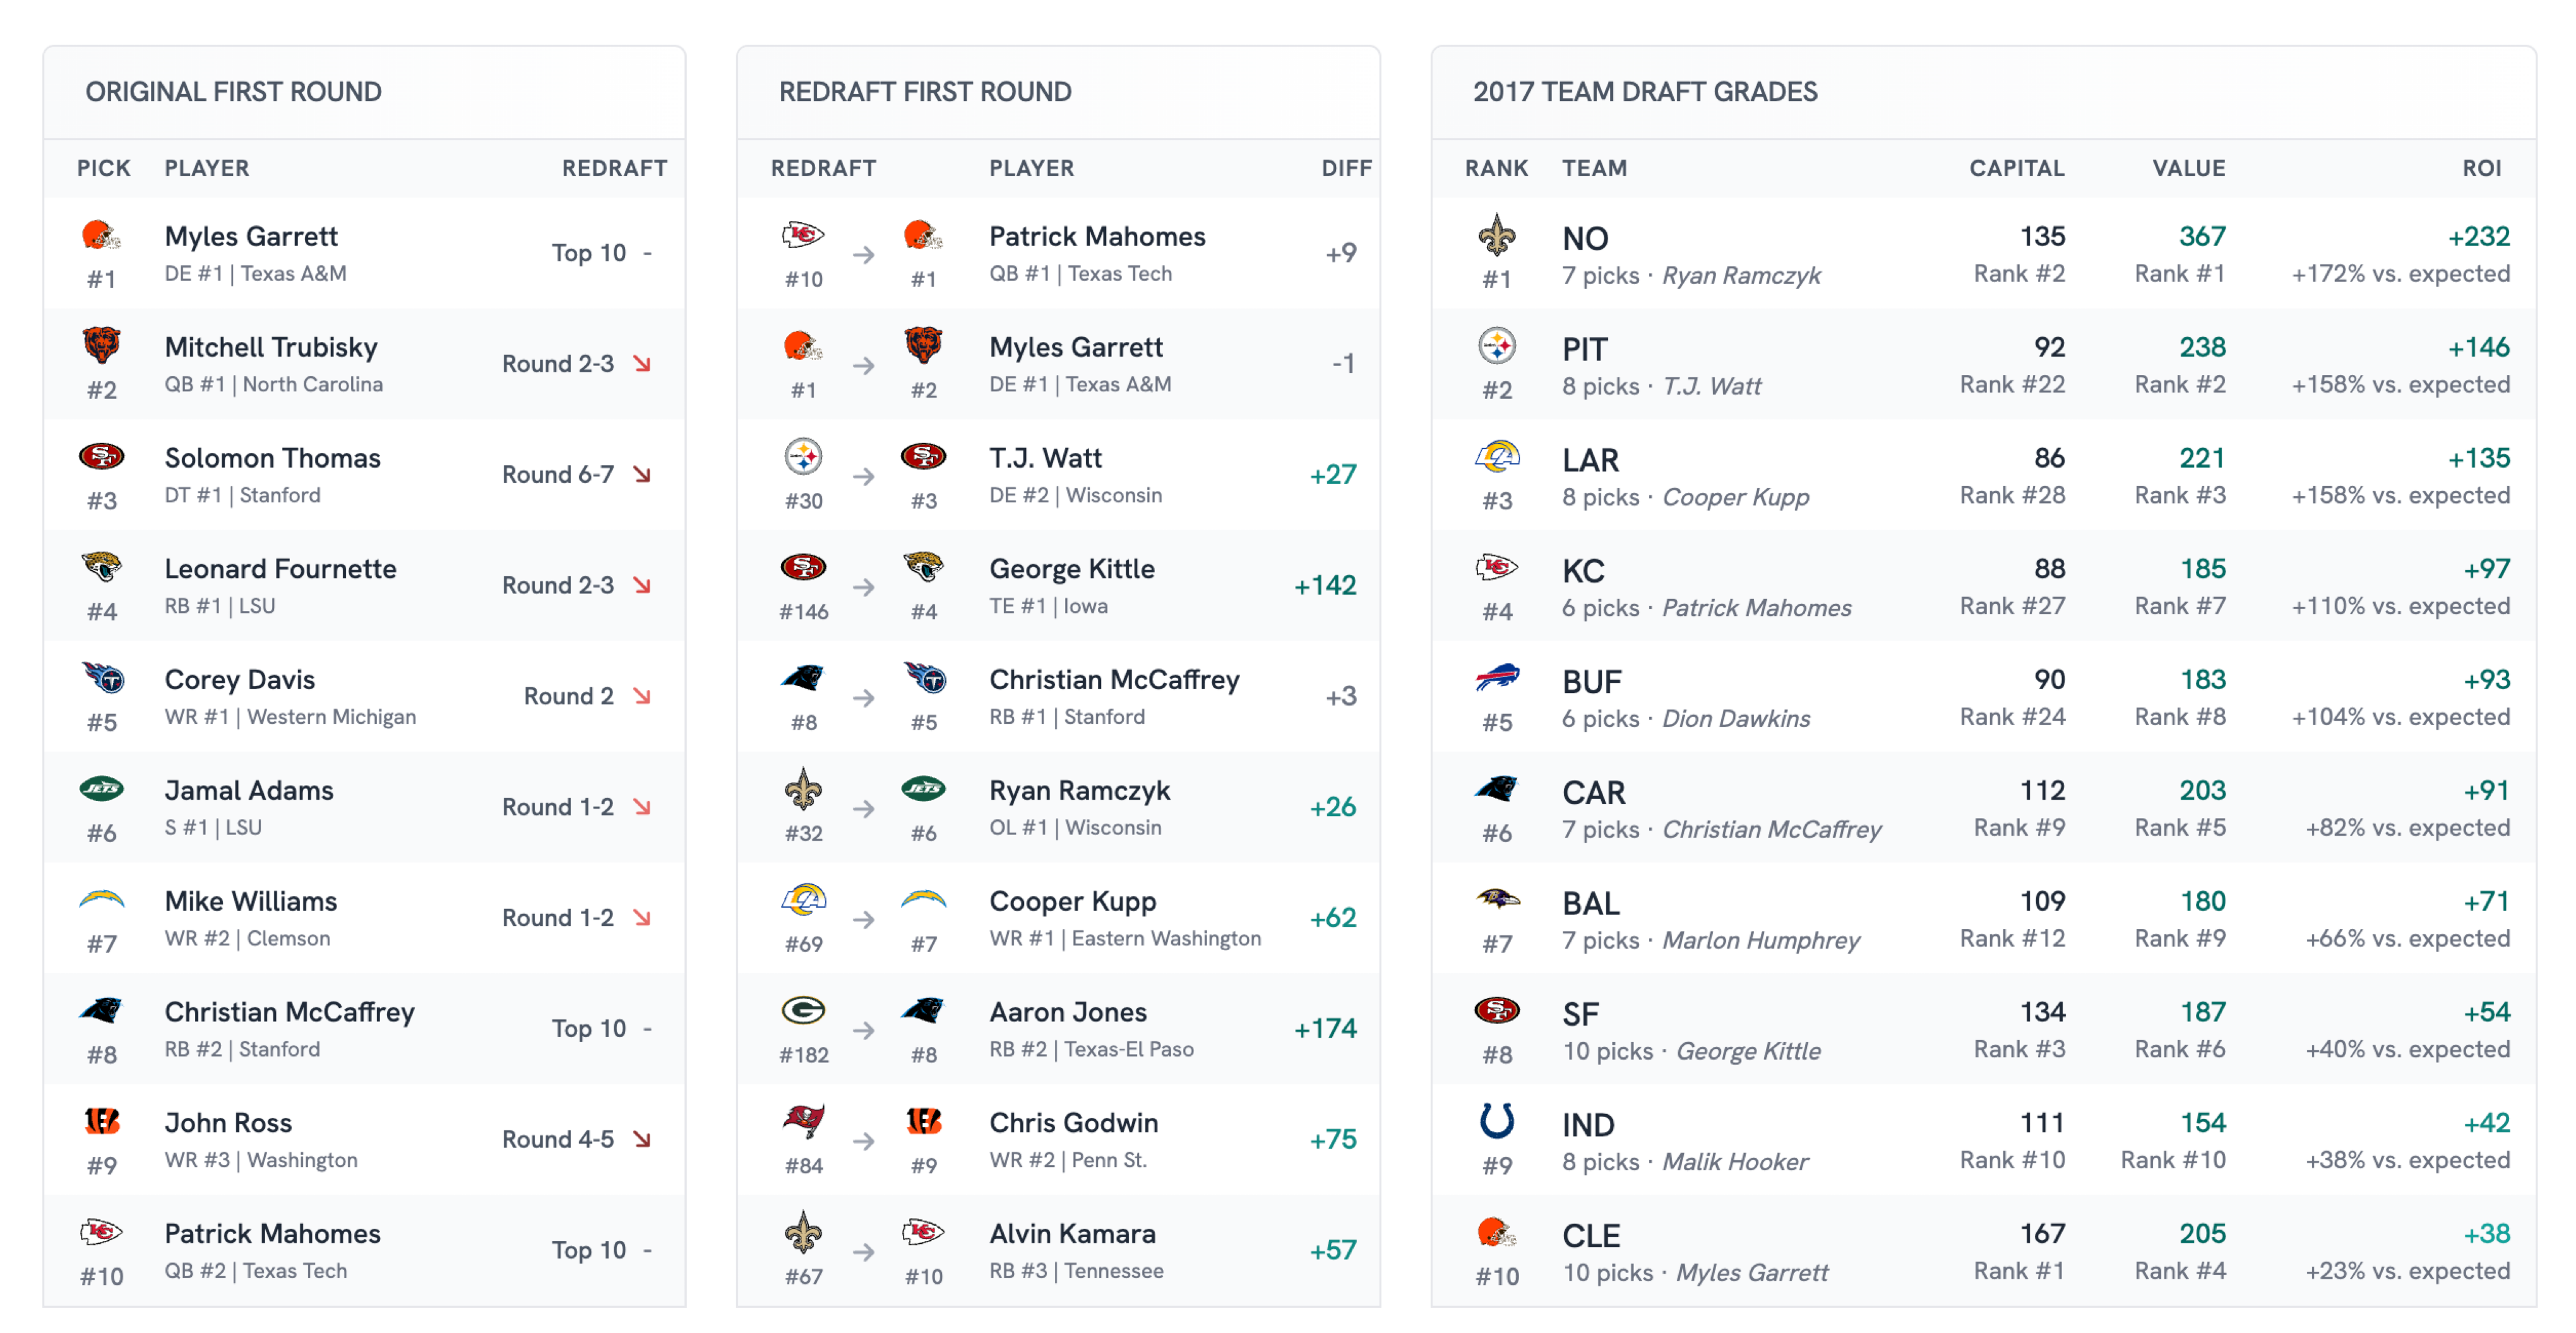
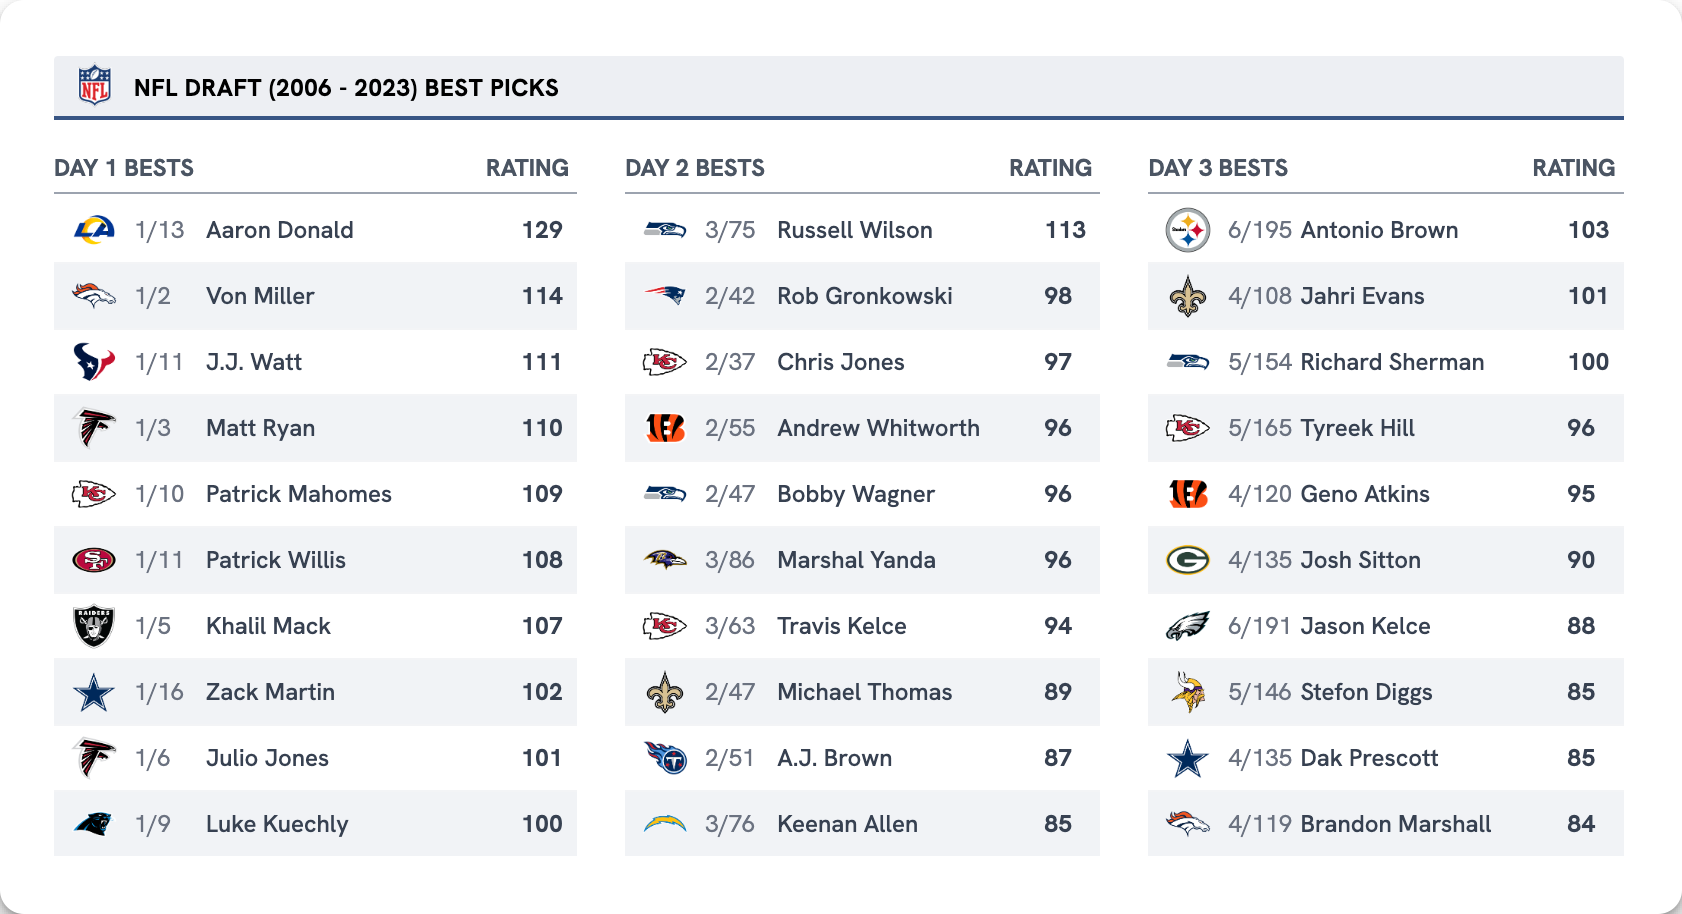
NFLComplete draft analysis with redraft rankings and team performance grades
By Rob Moore
 NFL
NFLExplore the most exciting NFL games using play-by-play win probability analysis
By Rob Moore
 NFL
NFLExplore every NFL score ever with our interactive visualization
By Shri Khalpada & Rob Moore
 NFL
NFLExplore 20 years of NFL Draft Surprises
By Rob Moore
 NFL
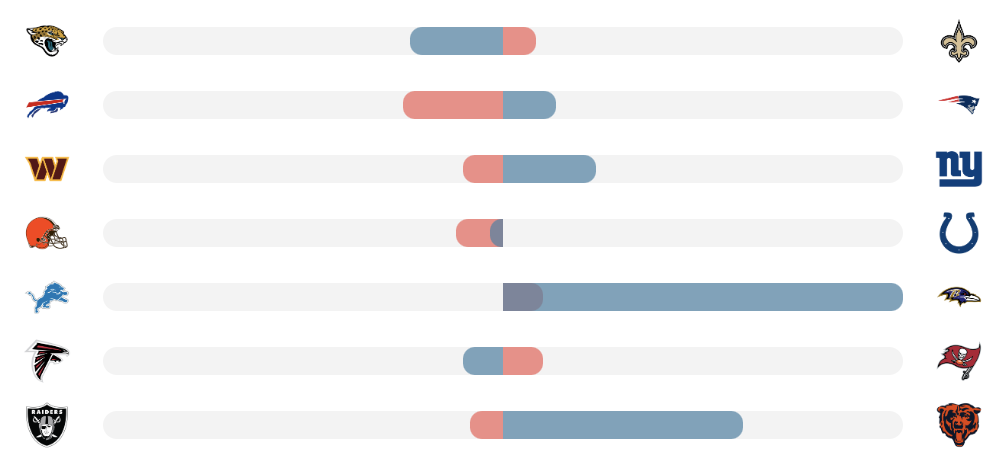
NFLExplore over 25 years of upsets and blowouts
By Shri Khalpada & Rob Moore
 NFL
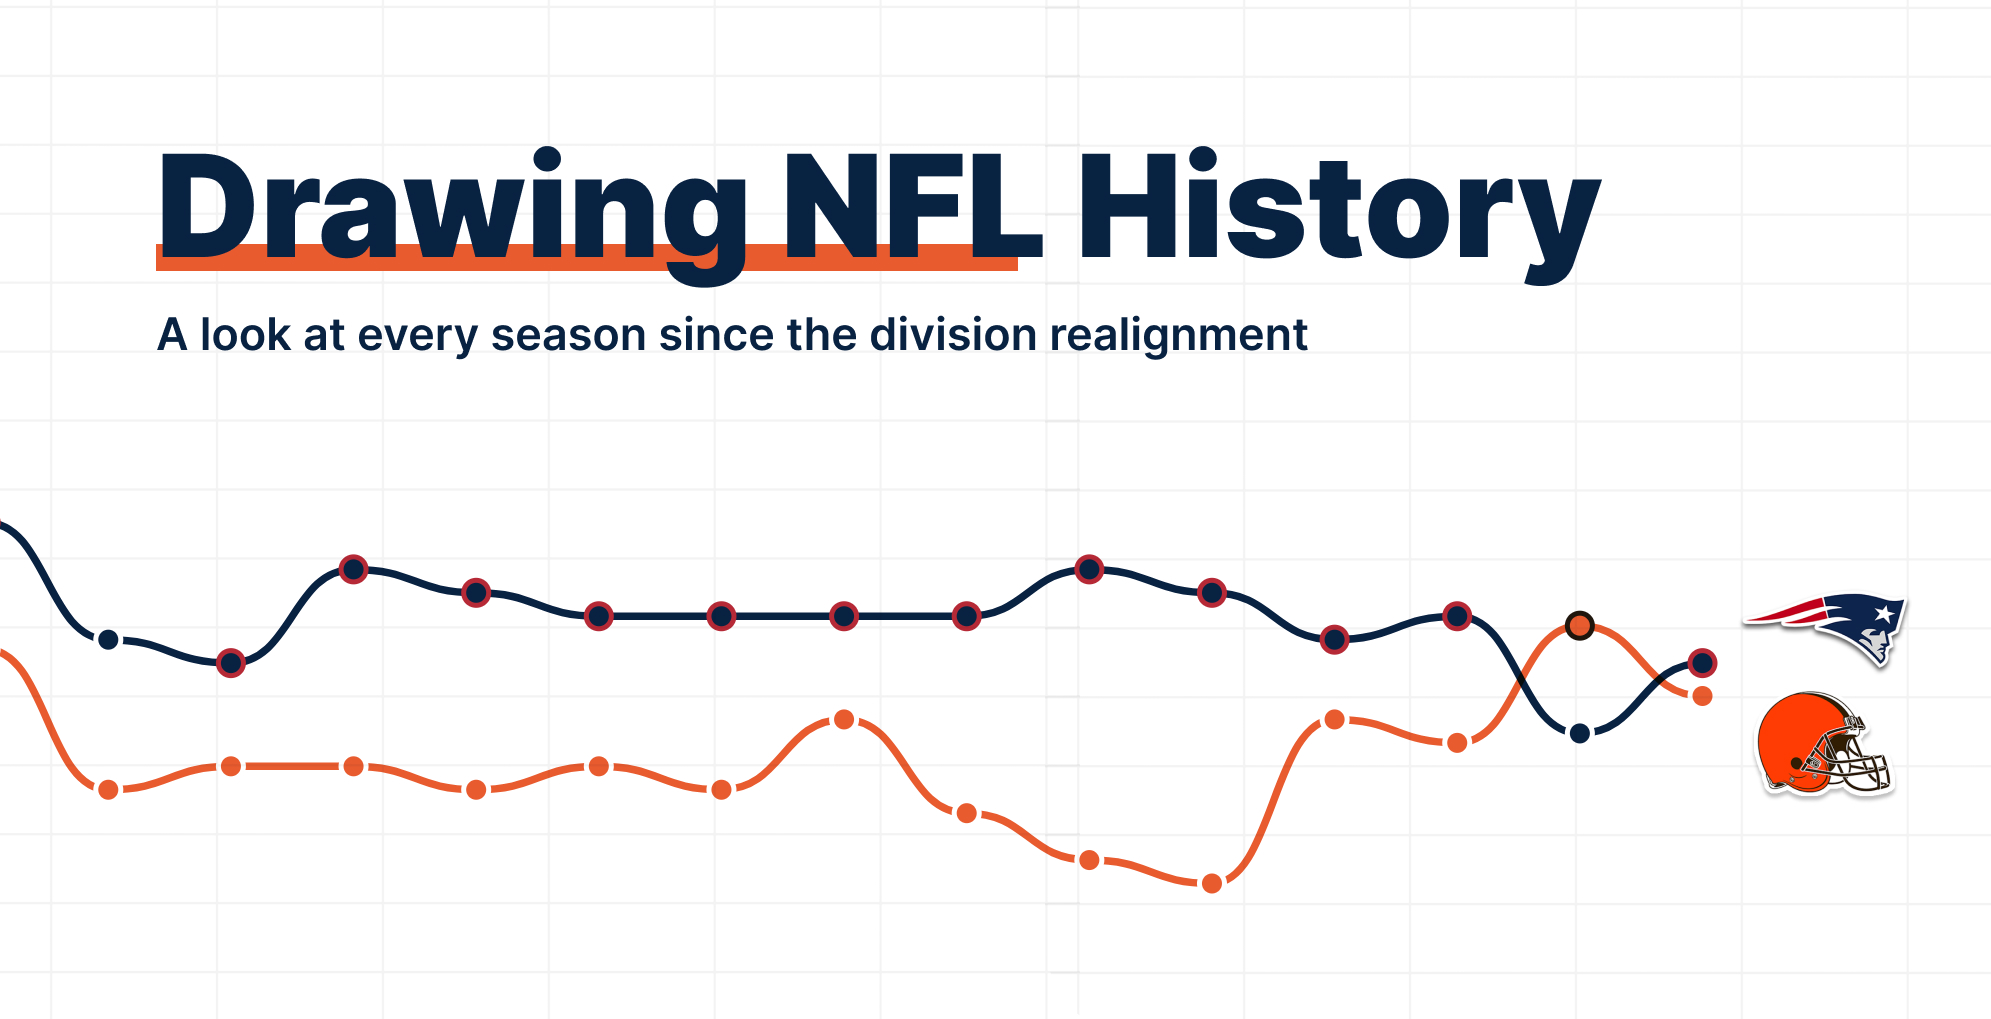
NFLExplore the final standings of each season in the NFL since the division re-alignment
By Rob Moore
 WORLD
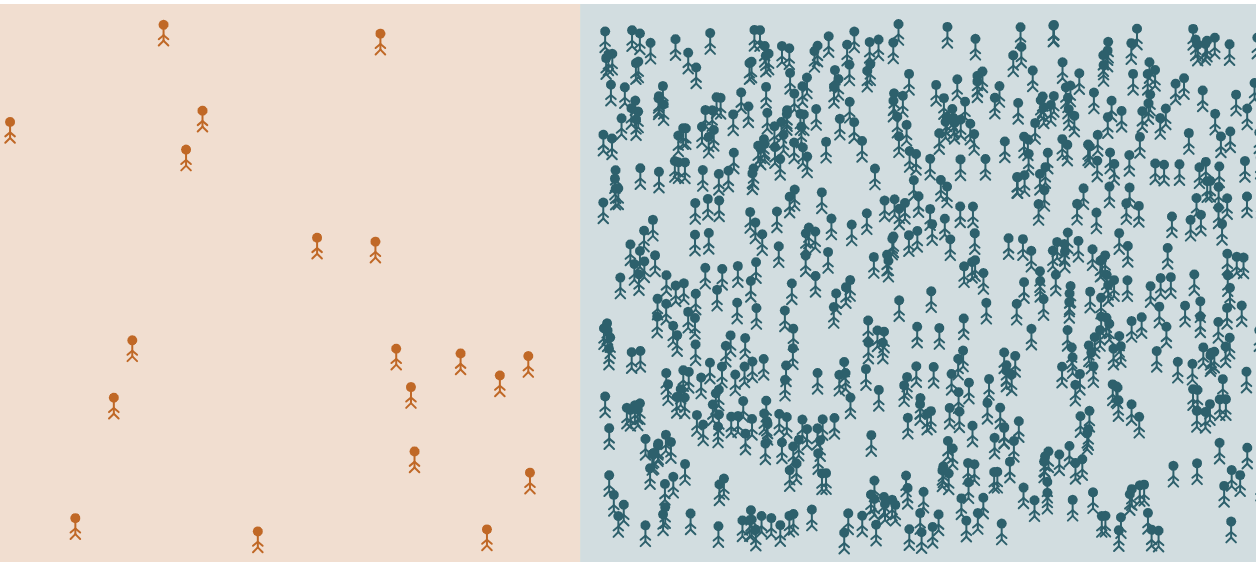
WORLDAn interactive exploration of American wealth inequality using data visualizations.
By Shri Khalpada
 WORLD
WORLDA data-driven analysis of voter fraud claims, their real-world impact, and the misleading narratives that fuel them.
By Shri Khalpada
 WORLD
WORLDVisualize climate change data with a 3D globe
By Shri Khalpada
 WORLD
WORLDExplore regulatory job data with interactive visualizations
By Rob Moore & Shri Khalpada
 WORLD
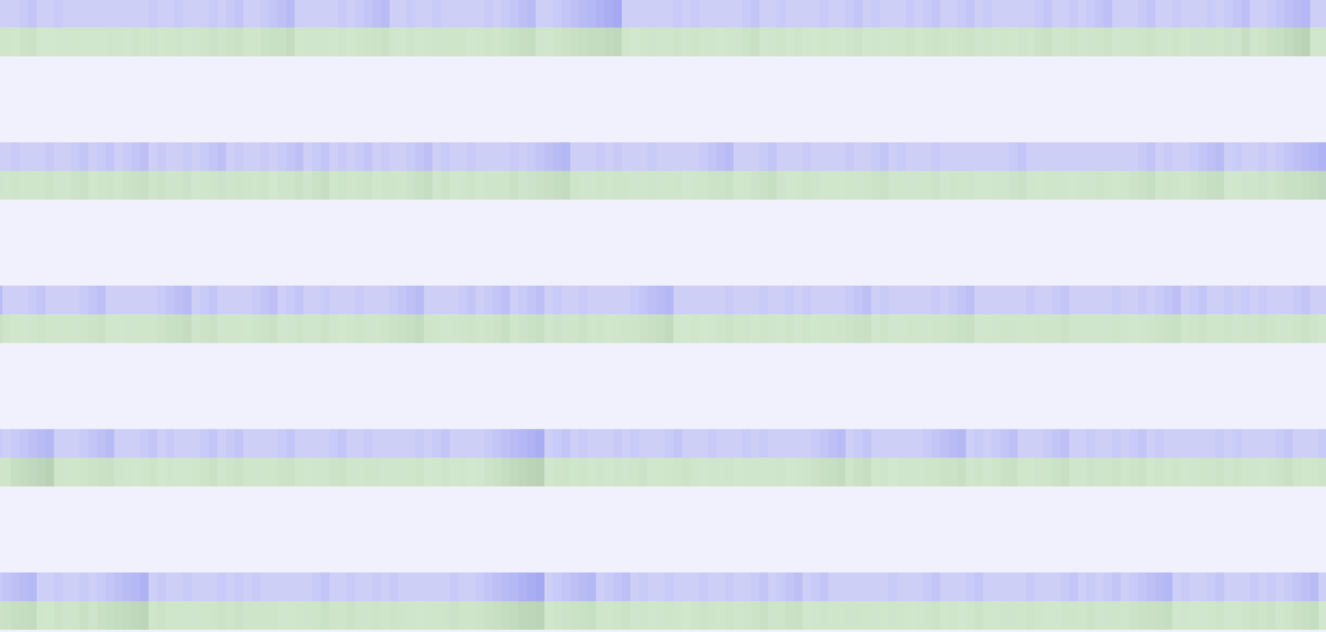
WORLDVisualizing Consumer Price Index Data Across Eight Categories
By Shri Khalpada
 WORLD
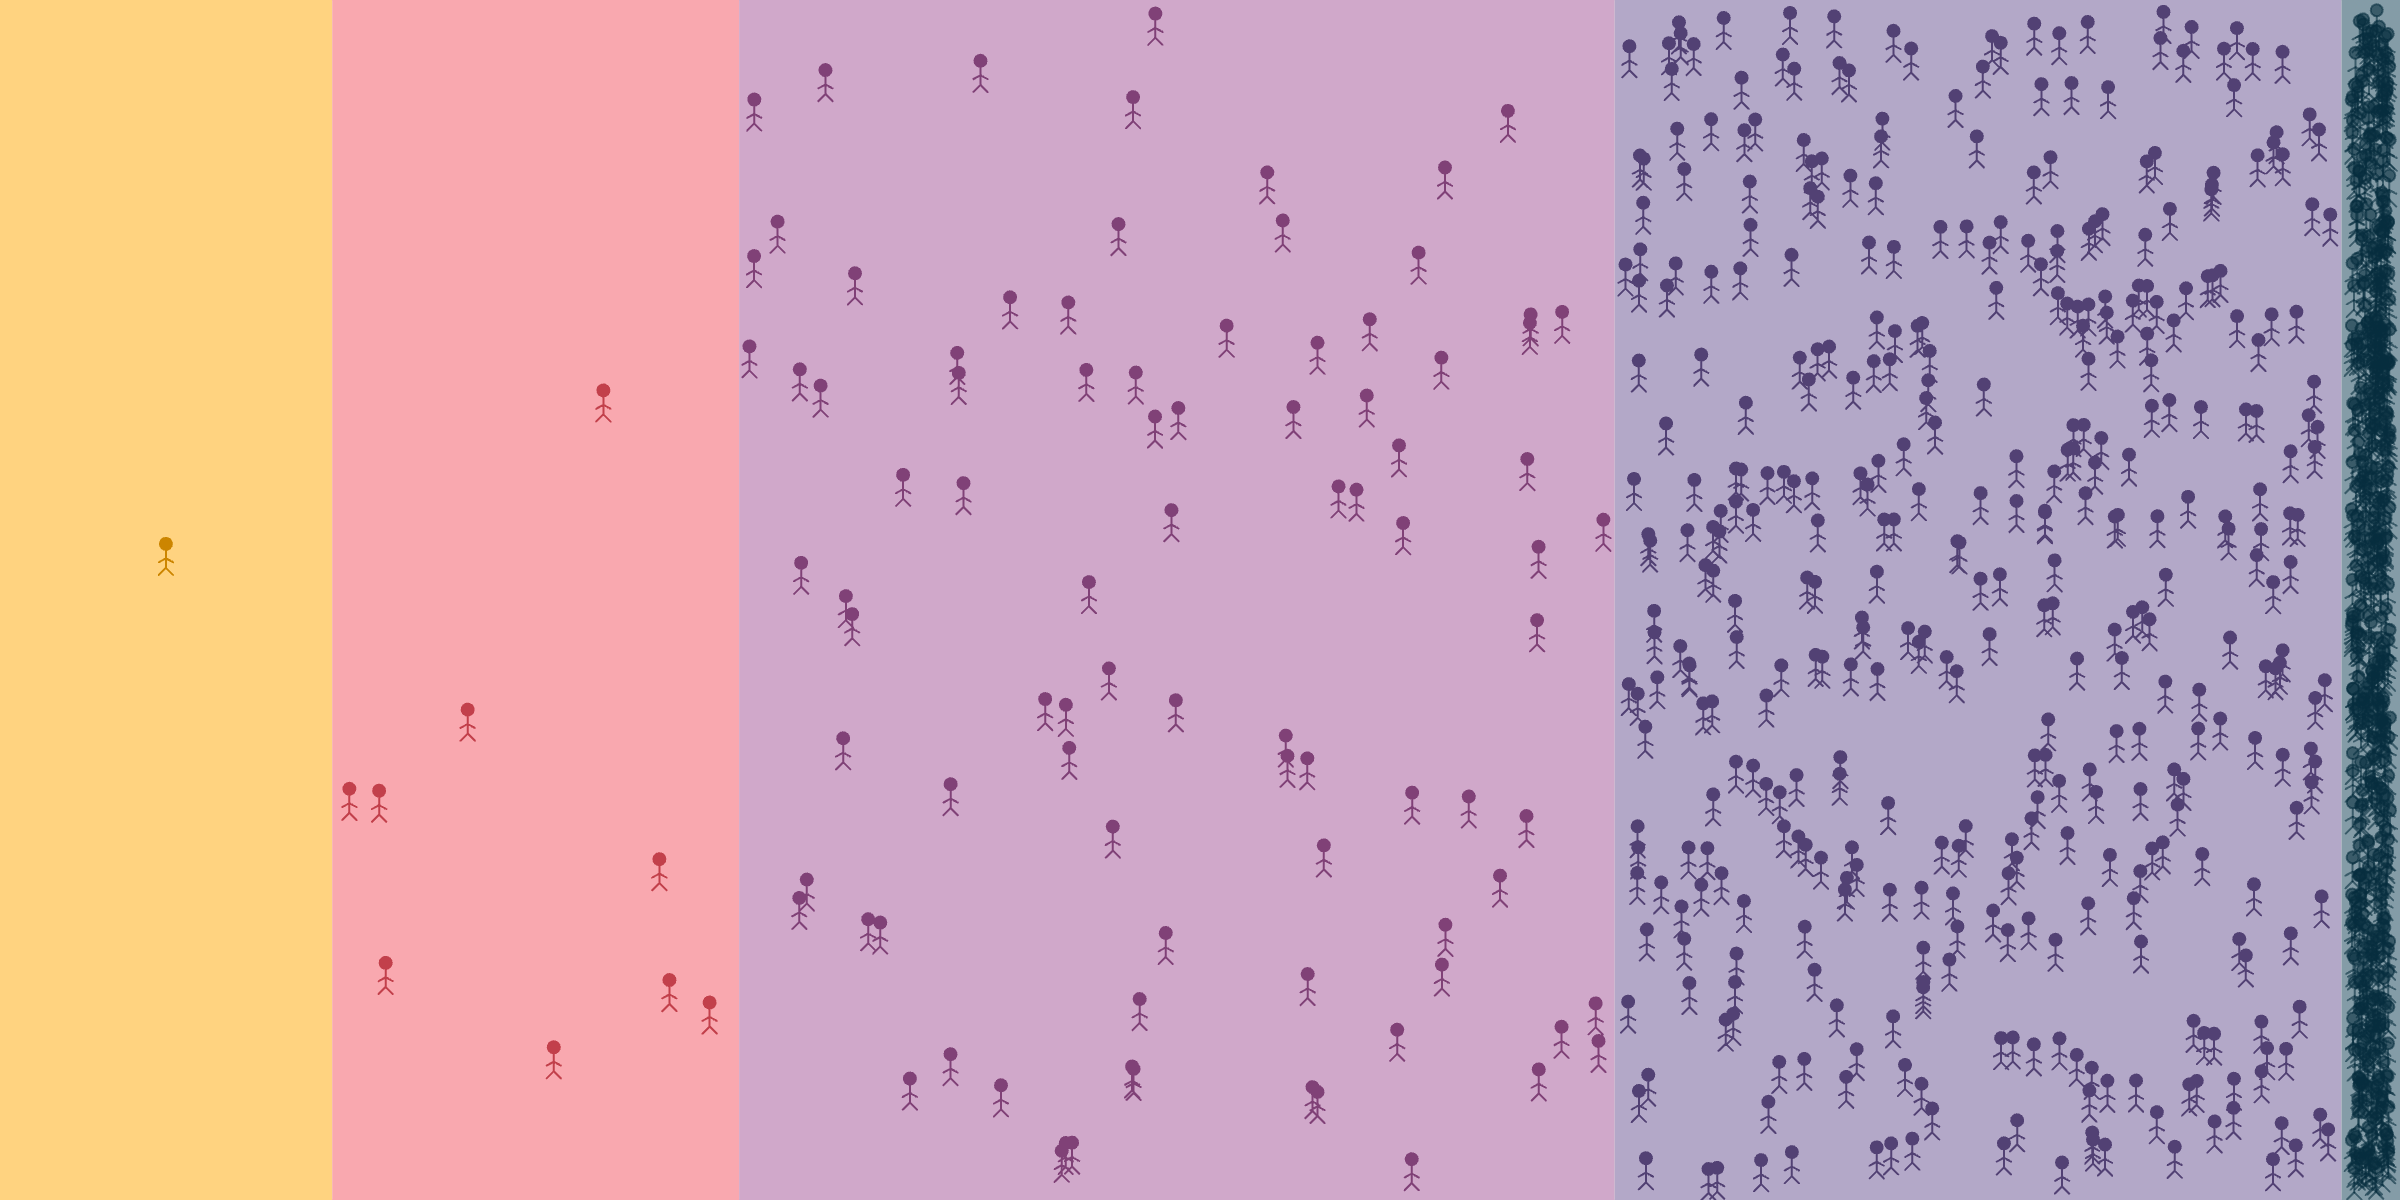
WORLDExplore global wealth inequality with an interactive visualization
By Shri Khalpada
 CRAFT
CRAFTThe case for less rigor and more nuance
By Shri Khalpada
 CRAFT
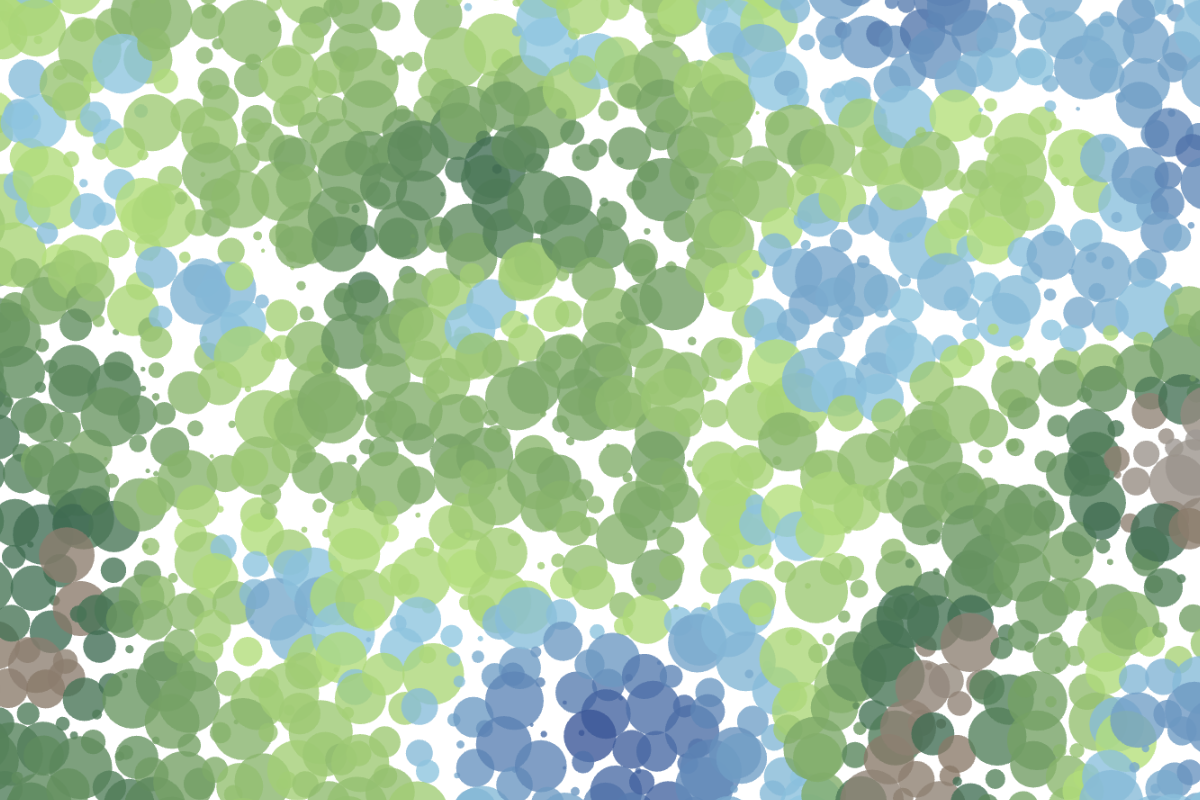
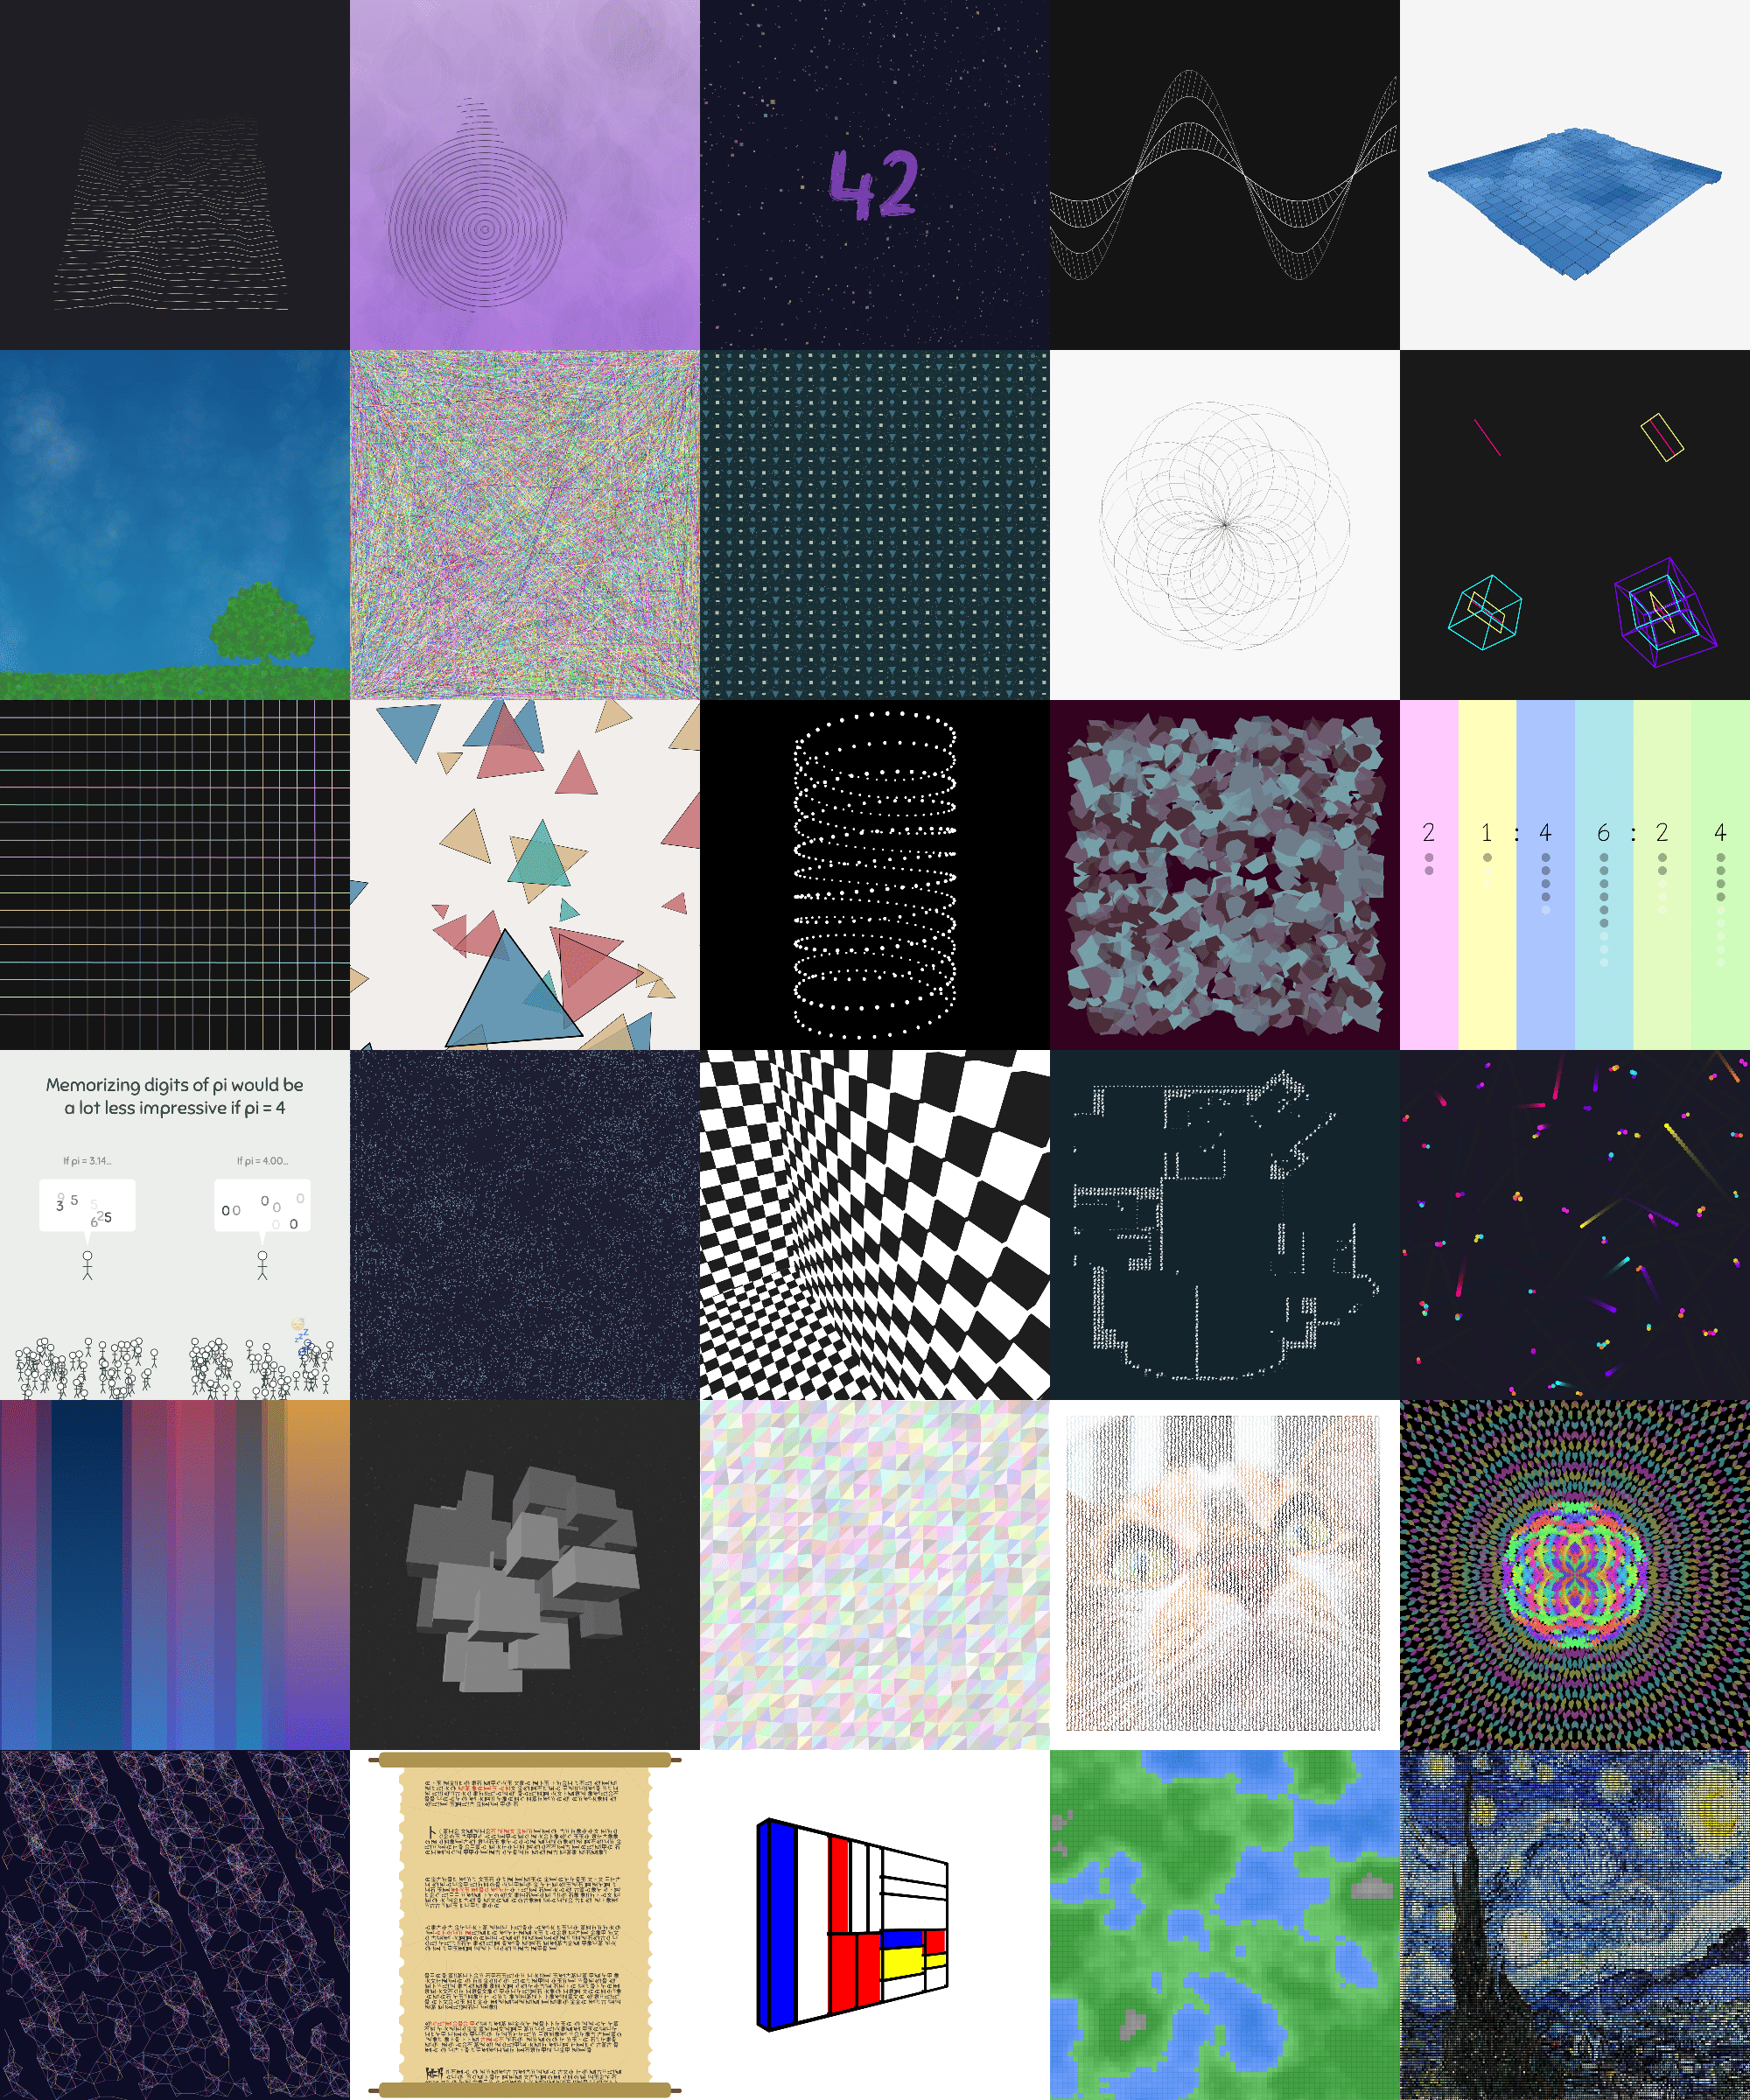
CRAFTA collection of 30 hands-on p5.js sketches designed to inspire creative coding. Explore generative art, animation, and interactive design through playful experimentation.
By Shri Khalpada
 CRAFT
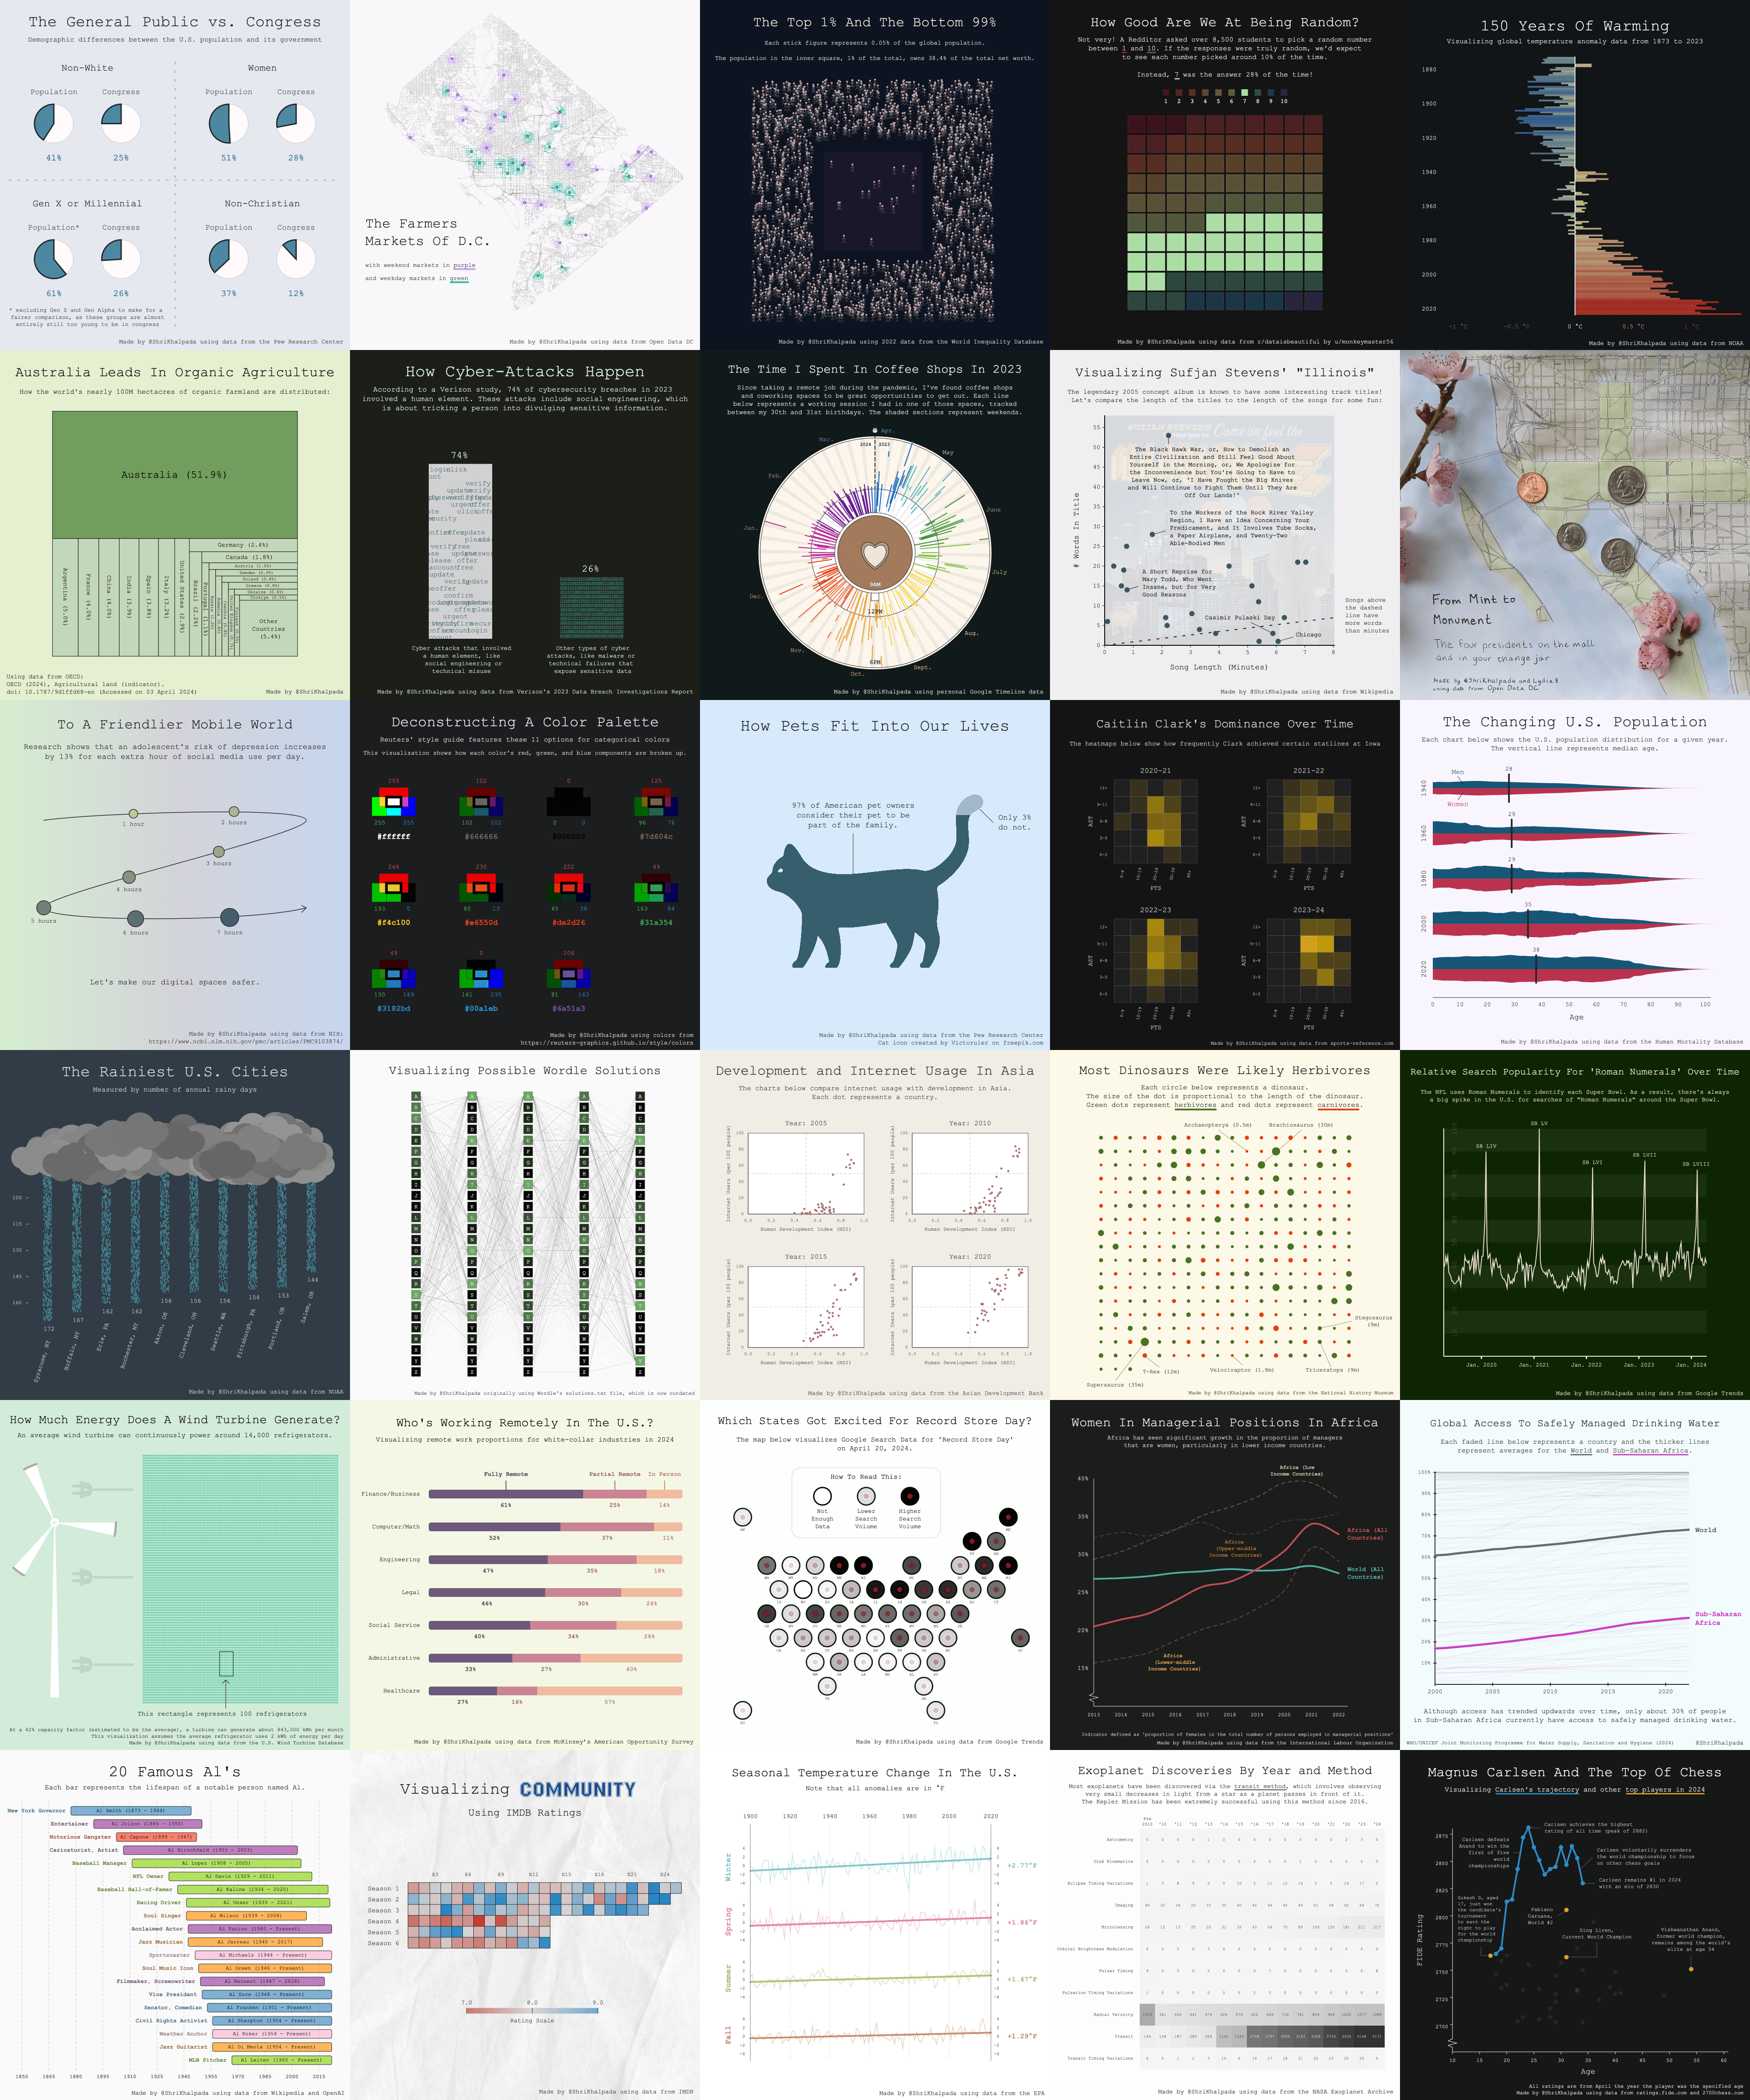
CRAFTMy Experience Doing The #30DayChartChallenge In 2024
By Shri Khalpada
 CRAFT
CRAFTA collection of 31 creative coding sketches for Genuary 2025.
By Shri Khalpada
 CRAFT
CRAFTA gentle introduction to interactive data visualization
By Shri Khalpada
 CRAFT
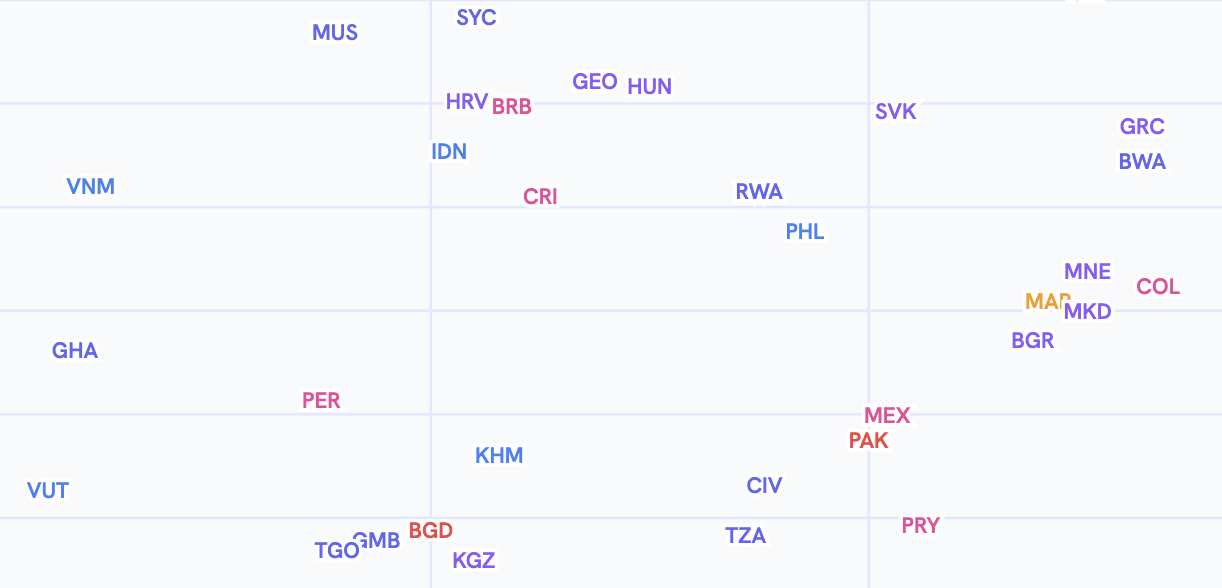
CRAFTDiving into different ways to visualize happiness data
By Shri Khalpada